52SIGNAL RECIPE AMA Momentum Vector═══52SIGNAL RECIPE AMA Momentum Vector═══
◆ Overview
52SIGNAL RECIPE AMA Momentum Vector is an advanced technical indicator based on Adaptive Moving Average (AMA), integrating volume filtering and gradient zone visualization to provide comprehensive analysis of price trends and momentum.
It automatically adjusts to market conditions by calculating efficiency ratios, reducing noise while clearly capturing significant trends. The volume confirmation system helps traders identify high-probability entry and exit points with precision.
─────────────────────────────────────
◆ Key Features
• Adaptive Moving Average: Smart moving average that automatically adjusts based on market conditions
• Volume Filter Integration: Double-confirmation of important price movements through volume analysis
• Momentum Gradient Zones: Intuitive visualization of trend strength through color gradation
• Signal Confirmation System: Generation of high-reliability buy/sell signals by combining multiple factors
• Trend Direction Identification: Clear color distinction between bullish and bearish market conditions
• Automatic Adaptation: Intelligent design that self-adjusts to various market situations
─────────────────────────────────────
◆ Technical Foundation
■ AMA Calculation Principles
• Efficiency Ratio (ER): Measures how efficiently price moves in one direction
• Dynamic Smoothing Coefficient: Automatically adjusts faster or slower based on market conditions
• Adaptive Algorithm: Less sensitive during sideways markets, more responsive during trending markets
• Noise Reduction Function: Filters out meaningless price movements while capturing important signals
■ Momentum Vector Implementation
• Trend-Price Distance Calculation: Measures trend strength by the distance between AMA and current price
• Color Gradation: Visual system where color intensity changes proportionally to trend strength
• ATR-Based Adjustment: Automatically adjusts gradient zone width according to market volatility
• Directional Color Distinction: Intuitive display with blue/cyan for uptrends and red for downtrends
─────────────────────────────────────
◆ Practical Applications
■ Price Trend Interpretation
• Trend Direction Assessment:
▶ Price above AMA with blue gradation indicates ongoing bullish momentum
▶ Price below AMA with red gradation indicates ongoing bearish momentum
• Momentum Strength Verification:
▶ Deeper gradient colors mean stronger momentum and healthier trends
▶ Lighter gradient colors suggest weakening momentum and potential reversal
■ Trading Strategy Utilization
• Trend Following Strategy:
▶ Buy signal when price crosses above AMA with increased volume
▶ Sell signal when price crosses below AMA with increased volume
• Momentum Confirmation Trading:
▶ Deep gradation increases confidence in trend continuation for entry decisions
▶ Multiple consecutive candles staying on one side of AMA increases trend reliability
─────────────────────────────────────
◆ Advanced Configuration Options
■ Input Parameter Guide
• Fast Period (Default: 2)
▶ 1-2: Responds very quickly to price changes. Suitable for short-term trading.
▶ 3-5: Moderate response that reduces frequent signals.
▶ 6-10: Slower response but captures only more definitive trends.
• Slow Period (Default: 30)
▶ 20-25: AMA moves faster. Good for shorter timeframe trading.
▶ 26-35: Balanced speed suitable for most market conditions.
▶ 36-50: AMA moves slowly, smoothly following long-term trends.
• Efficiency Ratio Period (Default: 10)
▶ 5-8: Focuses more on recent price movements. Responds quickly to changes.
▶ 9-12: Balanced period suitable for most situations.
▶ 13-20: Considers longer-term price movements, ignoring temporary fluctuations.
• Volume Average Period (Default: 20)
▶ 10-15: Compares with the average volume of the last 10-15 days. More sensitive to changes.
▶ 16-25: Compares with the average volume of approximately the last month. Balanced setting.
▶ 26-50: Compares with long-term average volume, capturing only truly significant volume changes.
• Volume Threshold Multiplier (Default: 1.2)
▶ 1.0-1.1: Recognizes volume just 10% above average as valid.
▶ 1.2-1.5: Requires volume 20-50% higher than average (e.g., 1.2 means 120% of average).
▶ 1.6-2.0: Recognizes only very high volume at least 1.6 times (160%) above average.
■ Timeframe-Specific Recommended Settings
• Short Timeframes (5min-1hr):
Fast Period 2, Slow Period 20, Efficiency Ratio Period 8
→ Responds quickly to price changes, suitable for day trading.
• Medium Timeframes (4hr-daily):
Fast Period 2, Slow Period 30, Efficiency Ratio Period 10
→ Most balanced setting for general swing trading.
• Long Timeframes (daily-weekly):
Fast Period 2, Slow Period 40, Efficiency Ratio Period 14
→ Optimized for smoothly tracking longer trends.
■ Market-Specific Recommended Settings
• Stock Market:
Volume Threshold 1.2, Volume Average Period 20
→ Signal is valid when volume is 20% above average.
• Forex Market:
Volume Threshold 1.5, Efficiency Ratio Period 12
→ Forex requires higher volume to be meaningful and slightly longer efficiency measurement.
• Cryptocurrency Market:
Volume Threshold 1.3, Fast Period 2, Slow Period 25
→ Settings optimized for highly volatile cryptocurrencies.
─────────────────────────────────────
◆ Synergy with Other Indicators
• Moving Averages: Trend reliability increases when AMA and key moving averages point in the same direction
• RSI/Stochastic: Powerful reversal signals when AMA crossovers occur in overbought/oversold zones
• MACD: Signal probability greatly increases when MACD histogram direction changes coincide with AMA crossovers
• Bollinger Bands: Trend strength can be determined by AMA's position within Bollinger Bands
• Support/Resistance Levels: Success probability dramatically increases when AMA breakouts occur at key price levels
─────────────────────────────────────
◆ Conclusion
AMA Momentum Vector provides accurate price trend analysis by combining the advanced features of adaptive moving averages with momentum visualization technology.
It perfectly adapts to constantly changing market environments through its self-adjusting algorithm and generates highly reliable trading signals through its volume confirmation system.
Users can optimize the indicator for their trading style and market conditions with simple parameter adjustments, enabling effective trading decisions that comprehensively consider price direction, momentum strength, and volume confirmation.
─────────────────────────────────────
※ Disclaimer: Past performance does not guarantee future results. Always use appropriate risk management strategies.
═══52SIGNAL RECIPE AMA Momentum Vector═══
◆ 개요
52SIGNAL RECIPE AMA Momentum Vector는 적응형 이동평균(AMA)을 기반으로 한 고급 기술적 지표로, 볼륨 필터링과 그라데이션 존 시각화를 통합하여 가격 추세와 모멘텀을 종합적으로 분석합니다.
시장 효율성 비율을 자동으로 계산하여 시장 상황에 맞게 스스로 조정되며, 노이즈는 줄이고 중요한 추세는 선명하게 포착합니다. 또한 볼륨 확인 시스템을 통해 높은 확률의 매매 시점을 정확하게 식별할 수 있도록 도와줍니다.
─────────────────────────────────────
◆ 주요 특징
• 적응형 이동평균: 시장 상황에 따라 자동으로 조정되는 스마트한 이동평균선
• 볼륨 필터 통합: 중요한 가격 움직임을 볼륨으로 한번 더 확인
• 모멘텀 그라데이션 존: 색상 그라데이션으로 추세의 강도를 직관적으로 시각화
• 신호 확인 시스템: 여러 요소를 종합하여 신뢰도 높은 매수/매도 신호 생성
• 추세 방향 식별: 상승세와 하락세를 색상으로 명확하게 구분
• 자동 적응 기능: 다양한 시장 상황에 알아서 맞춰지는 지능형 설계
─────────────────────────────────────
◆ 기술적 기반
■ AMA 계산 원리
• 효율성 비율 (ER): 가격이 얼마나 효율적으로 한 방향으로 움직이는지 측정
• 동적 평활화 계수: 시장 상황에 따라 빠르거나 느리게 자동 조절되는 계수
• 적응형 알고리즘: 횡보장에서는 둔감하게, 추세장에서는 민감하게 반응
• 노이즈 감소 기능: 무의미한 가격 움직임은 걸러내고 중요한 신호만 포착
■ 모멘텀 벡터 구현
• 추세-가격 거리 계산: AMA와 현재 가격 사이의 거리로 추세 강도 측정
• 색상 그라데이션: 추세 강도에 비례하여 색상 농도가 변하는 시각화 시스템
• ATR 기반 조정: 시장 변동성에 맞춰 그라데이션 영역 너비 자동 조절
• 방향성 색상 구분: 상승세는 파란색/청록색, 하락세는 빨간색으로 직관적 표시
─────────────────────────────────────
◆ 실용적 응용
■ 가격 추세 해석
• 추세 방향 판단:
▶ 가격이 AMA 위에 있고 파란색 그라데이션이 보이면 상승 모멘텀 진행 중
▶ 가격이 AMA 아래에 있고 빨간색 그라데이션이 보이면 하락 모멘텀 진행 중
• 모멘텀 강도 확인:
▶ 그라데이션 색상이 진할수록 모멘텀이 강하고 추세가 건강함을 의미
▶ 그라데이션 색상이 옅을수록 모멘텀이 약해지고 있으며 반전 가능성 시사
■ 트레이딩 전략 활용
• 추세 추종 전략:
▶ 가격이 AMA를 상향 돌파하고 볼륨이 증가하면 매수 신호
▶ 가격이 AMA를 하향 돌파하고 볼륨이 증가하면 매도 신호
• 모멘텀 확인 트레이딩:
▶ 진한 그라데이션은 추세 지속 가능성이 높음을 의미하므로 진입 확신 강화
▶ 여러 캔들이 연속해서 AMA 한쪽에 머물면 추세의 신뢰도가 높아짐
─────────────────────────────────────
◆ 고급 설정 옵션
■ 인풋 파라미터 가이드
• 빠른 기간 (Fast Period) (기본값: 2)
▶ 1-2: 가격 변화에 매우 빠르게 반응합니다. 단기 거래에 적합합니다.
▶ 3-5: 적당히 반응하여 잦은 신호를 줄여줍니다.
▶ 6-10: 반응이 느리지만 더 확실한 추세만 포착합니다.
• 느린 기간 (Slow Period) (기본값: 30)
▶ 20-25: AMA가 더 빠르게 움직입니다. 짧은 시간 거래에 좋습니다.
▶ 26-35: 균형 잡힌 속도로 대부분의 시장 상황에 적합합니다.
▶ 36-50: AMA가 천천히 움직여 장기 추세를 부드럽게 따라갑니다.
• 효율성 비율 기간 (Efficiency Ratio Period) (기본값: 10)
▶ 5-8: 최근 가격 움직임에 더 집중합니다. 변화에 빠르게 반응합니다.
▶ 9-12: 균형 잡힌 기간으로 대부분의 상황에 적합합니다.
▶ 13-20: 더 긴 기간의 가격 움직임을 고려하여 일시적인 변동을 무시합니다.
• 볼륨 평균 기간 (Volume Average Period) (기본값: 20)
▶ 10-15: 최근 10-15일의 평균 볼륨과 비교합니다. 변화에 민감합니다.
▶ 16-25: 지난 약 한 달간의 평균 볼륨과 비교합니다. 균형 잡힌 설정입니다.
▶ 26-50: 장기 평균 볼륨과 비교하여 정말 큰 볼륨 변화만 포착합니다.
• 볼륨 임계값 승수 (Volume Threshold Multiplier) (기본값: 1.2)
▶ 1.0-1.1: 평균보다 약 10% 정도만 높아도 유효한 볼륨으로 인정합니다.
▶ 1.2-1.5: 평균보다 20~50% 높은 볼륨을 요구합니다(예: 1.2는 평균의 120%).
▶ 1.6-2.0: 평균의 최소 1.6배(160%) 이상 되는 매우 높은 볼륨만 인정합니다.
■ 타임프레임별 추천 설정
• 짧은 시간 차트 (5분-1시간):
빠른 기간 2, 느린 기간 20, 효율성 비율 기간 8
→ 가격 변화에 빠르게 반응하며 단타에 적합합니다.
• 중기 차트 (4시간-일봉):
빠른 기간 2, 느린 기간 30, 효율성 비율 기간 10
→ 일반적인 스윙 트레이딩에 가장 균형 잡힌 설정입니다.
• 장기 차트 (일봉-주봉):
빠른 기간 2, 느린 기간 40, 효율성 비율 기간 14
→ 더 긴 추세를 매끄럽게 추적하는 데 최적화되었습니다.
■ 시장별 추천 설정
• 주식 시장:
볼륨 임계값 1.2, 볼륨 평균 기간 20
→ 평균보다 20% 많은 볼륨이 있을 때 신호가 유효합니다.
• 외환 시장:
볼륨 임계값 1.5, 효율성 비율 기간 12
→ 외환은 볼륨이 더 높아야 의미가 있으며, 약간 더 긴 효율성 측정이 필요합니다.
• 암호화폐 시장:
볼륨 임계값 1.3, 빠른 기간 2, 느린 기간 25
→ 변동성이 큰 암호화폐에 최적화된 설정입니다.
─────────────────────────────────────
◆ 다른 지표와의 시너지
• 이동평균선: AMA와 주요 이동평균선이 같은 방향을 가리킬 때 추세 신뢰도 상승
• RSI/스토캐스틱: 과매수/과매도 구간에서 AMA 교차 발생 시 강력한 반전 신호
• MACD: MACD 히스토그램 방향 변화와 AMA 교차가 일치하면 신호 확률 대폭 증가
• 볼린저 밴드: AMA가 볼린저 밴드 내에서 어떤 위치에 있는지로 추세 강도 판단
• 지지/저항 레벨: 중요 가격대에서 AMA 돌파 시 성공 확률이 크게 증가
─────────────────────────────────────
◆ 결론
AMA Momentum Vector는 적응형 이동평균의 고급 기능과 모멘텀 시각화 기술을 결합하여 정확한 가격 추세 분석을 제공합니다.
자체 조정 알고리즘으로 시시각각 변하는 시장 환경에 완벽하게 적응하며, 볼륨 확인 시스템을 통해 신뢰도 높은 매매 신호를 생성합니다.
사용자는 간단한 파라미터 조정으로 자신의 거래 스타일과 시장 상황에 맞게 지표를 최적화할 수 있어, 가격 방향, 모멘텀 강도, 볼륨 확인을 종합적으로 고려한 효과적인 거래 결정을 내릴 수 있습니다.
─────────────────────────────────────
※ 면책 조항: 과거 성과가 미래 결과를 보장하지 않습니다. 항상 적절한 리스크 관리 전략을 사용하세요.
Pesquisar nos scripts por "swing trading"
Mohammad - OBs, BOS, S/R, Elliott Waves & Trend LinesProfessional Trading Indicator System - Technical Analysis Suite
Overview
Advanced technical analysis system integrating ICT/SMC methodologies with classical analysis tools. Features seven analytical components for comprehensive market structure analysis.
Components
1. Order Blocks (ICT/SMC)
Identifies institutional accumulation/distribution zones acting as future support/resistance.
Detection: Automatic identification based on price rejection patterns
Management: Dynamic updates and removal of invalidated blocks
Configuration: Sensitivity levels (High/Medium/Low), ATR-based parameters
Visual: Green support, red resistance with transparency
2. Break of Structure (BOS)
Detects significant structural breaks indicating trend changes.
Method: 5-bar swing point formation
Display: White horizontal lines with labels
Range: 50-bar maximum lookback
3. Support & Resistance
Classical horizontal levels from significant price pivots.
Analysis: 300-bar historical scan
Filter: 10-point duplicate tolerance
Display: Maximum 15 levels within 5% of current price
4. Fair Value Gaps (FVG)
Price inefficiencies that often get filled on return.
Types: Bullish gaps (up) and bearish gaps (down)
Size: Minimum 0.1 ATR or 5 points
Management: Auto-removal when filled
5. Elliott Wave Analysis
Advanced pattern recognition for impulse and corrective waves.
Patterns: 5-wave impulse (1-2-3-4-5), 3-wave corrective (A-B-C)
Adaptive: Auto-adjusts to timeframe (3-10 depth range)
Display: Small dots with large numbers, starts from hidden point 0
6. 45-Degree Momentum Lines
Revolutionary projection system based on consecutive candle sequences.
Bearish Lines (Red):
Trigger: 5+ consecutive red candles
Start: HIGH of first red candle
Labels: B1-B5
Bullish Lines (Green):
Trigger: 5+ consecutive green candles
Start: LOW of first green candle
Labels: T1-T5
Specifications:
Angle: 45° using ATR * 0.15
Extension: 30 bars forward
Display: 5 most recent patterns
7. Classical Trend Lines
Multi-touch diagonal support/resistance detection.
Validation: Minimum touch requirements
Tolerance: ATR-based touch detection
Display: Blue lines with optional labels
Configuration Summary
Global Settings:
Show/hide each component individually
Customizable colors and line widths
Label size options
Performance:
50-bar periodic cleanup
Maximum object limits (500 each)
Conditional processing on bar close
Trading Applications
Scalping: Order Blocks + FVGs + 45° Lines
Day Trading: All components with BOS emphasis
Swing Trading: Elliott Waves + Trend Lines
Position Trading: Major levels + Elliott Waves
Key Strategies:
Use 45° line bounces for entries
Combine Order Blocks with 45° lines for confluence
Confirm BOS breaks with 45° line violations
Place stops beyond projection lines
Technical Requirements
Platform: TradingView Pine Script v5
Minimum: 300 historical bars
Optimal: 15m-4H timeframes
Performance: Moderate CPU usage
Color Scheme
Green: Bullish/Support (#26a69a)
Red: Bearish/Resistance (#ef5350)
White: BOS/S&R lines
Blue: Elliott Waves/Trend Lines
Customizable: 45° projection lines
Risk Disclaimer
Educational tool only. Not financial advice. Combine with risk management and personal analysis. Past performance doesn't guarantee future results. Trading involves substantial risk.

RISK ROTATION MATRIX ║ BullVision [3.0]🔍 Overview
The Risk Rotation Matrix is a comprehensive market regime detection system that analyzes global market conditions across four critical domains: Liquidity, Macroeconomic, Crypto/Commodities, and Risk/Volatility. Through proprietary algorithms and advanced statistical analysis, it transforms 20+ diverse market metrics into a unified framework for identifying regime transitions and risk rotations.
This institutional-grade system aims to solve a fundamental challenge: how to synthesize complex, multi-domain market data into clear, actionable trading intelligence. By combining proprietary liquidity calculations with sophisticated cross-asset analysis.
The Four-Domain Architecture
1. 💧 LIQUIDITY DOMAIN
Our liquidity analysis combines standard metrics with proprietary calculations:
Proprietary Components:
Custom Global Liquidity Index (GLI): Unique formula aggregating central bank assets, credit spreads, and FX dynamics through our weighted algorithm
Federal Reserve Balance Proxy: Advanced calculation incorporating reverse repos, TGA fluctuations, and QE/QT impacts
China Liquidity Proxy: First-of-its-kind metric combining PBOC operations with FX-adjusted aggregates
Global M2 Composite: Custom multi-currency M2 aggregation with proprietary FX normalization
2. 📈 MACRO DOMAIN
Sophisticated integration of global economic indicators:
S&P 500: Momentum and trend analysis with custom z-score normalization
China Blue Chips: Asian market sentiment with correlation filtering
MBA Purchase Index: Real estate market health indicator
Emerging Markets (EEMS): Risk appetite measurement
Global ETF (URTH): Worldwide equity exposure tracking
Each metric undergoes proprietary transformation to ensure comparability and regime-specific sensitivity.
3. 🪙 CRYPTO/COMMODITIES DOMAIN
Unique cross-asset analysis combining:
Total Crypto Market Cap: Liquidity flow indicator with custom smoothing
Bitcoin SOPR: On-chain profitability analysis with adaptive periods
MVRV Z-Score: Advanced implementation with multiple MA options
BTC/Silver Ratio: Novel commodity-crypto relationship metric
Our algorithms detect when crypto markets lead or lag traditional assets, providing crucial timing signals.
4. ⚡ RISK/VOLATILITY DOMAIN
Advanced volatility regime detection through:
MOVE Index: Bond volatility with inverse correlation analysis
VVIX/VIX Ratio: Volatility-of-volatility for regime extremes
SKEW Index: Tail risk measurement with custom normalization
Credit Stress Composite: Proprietary combination of credit spreads
USDT Dominance: Crypto flight-to-safety indicator
All risk metrics are inverted and normalized to align with the unified scoring system.
🧠 Advanced Integration Methodology
Multi-Stage Processing Pipeline
Data Collection: Real-time aggregation from 20+ sources
Normalization: Custom z-score variants accounting for regime-specific volatility
Domain Scoring: Proprietary weighting within each domain
Cross-Domain Synthesis: Advanced correlation matrix between domains
Regime Detection: State-transition model identifying four market phases
Signal Generation: Composite score with adaptive smoothing
🔁 Composite Smoothing & Signal Generation
The user can apply smoothing (ALMA, EMA, etc.) to highlight trends and reduce noise. Smoothing length, type, and parameters are fully customizable for different trading styles.
🎯 Color Feedback & Market Regimes
Visual dynamics (color gradients, labels, trails, and quadrant placement) offer an at-a-glance interpretation of the market’s evolving risk environment—without forecasting or forward-looking assumptions.
🎯 The Quadrant Visualization System
Our innovative visual framework transforms complex calculations into intuitive intelligence:
Dynamic Ehlers Loop: Shows current position and momentum
Trailing History: Visual path of regime transitions
Real-Time Animation: Immediate feedback on condition changes
Multi-Layer Information: Depth through color, size, and positioning
🚀 Practical Applications
Primary Use Cases
Multi-Asset Portfolio Management: Optimize allocation across asset classes based on regime
Risk Budgeting: Adjust exposure dynamically with regime changes
Tactical Trading: Time entries/exits using regime transitions
Hedging Strategies: Implement protection before risk-off phases
Specific Trading Scenarios
Domain Divergence: When liquidity improves but risk metrics deteriorate
Early Rotation Detection: Crypto/commodity signals often lead broader markets
Volatility Regime Trades: Position for mean reversion or trend following
Cross-Asset Arbitrage: Exploit temporary dislocations between domains
⚙️ How It Works
The Composite Score Engine
The system's intelligence emerges from how it combines domains:
Each domain produces a normalized score (-2 to +2 range)
Proprietary algorithms weight domains based on market conditions
Composite score indicates overall market regime
Smoothing options (ALMA, EMA, etc.) optimize for different timeframes
Regime Classification
🟢 Risk-On (Green): Positive composite + positive momentum
🟠 Weakening (Orange): Positive composite + negative momentum
🔵 Recovery (Blue): Negative composite + positive momentum
🔴 Risk-Off (Red): Negative composite + negative momentum
Signal Interpretation Framework
The indicator provides three levels of analysis:
Composite Score: Overall market regime (-2 to +2)
Domain Scores: Identify which factors drive regime
Individual Metrics: Granular analysis of specific components
🎨 Features & Functionality
Core Components
Risk Rotation Quadrant: Primary visual interface with Ehlers loop
Data Matrix Dashboard: Real-time display of all 20+ metrics
Domain Aggregation: Separate scores for each domain
Composite Calculation: Unified score with multiple smoothing options
Customization Options
Selective Metrics: Enable/disable individual components
Period Adjustment: Optimize lookback for each metric
Smoothing Selection: 10 different MA types including ALMA
Visual Configuration: Quadrant scale, colors, trails, effects
Advanced Settings
Pre-smoothing: Reduce noise before final calculation
Adaptive Periods: Automatic adjustment during volatility
Correlation Filters: Remove redundant signals
Regime Memory: Hysteresis to prevent whipsaws
📋 Implementation Guide
Setup Process
Add to chart (optimized for daily, works on all timeframes)
Review default settings for your market focus
Adjust domain weights based on trading style
Configure visual preferences
Optimization by Trading Style
Position Trading: Longer periods (60-150), heavy smoothing
Swing Trading: Medium periods (20-60), balanced smoothing
Active Trading: Shorter periods (10-40), minimal smoothing
Best Practices
Monitor domain divergences for early signals
Use extreme readings (-1.5/+1.5) for high-conviction trades
Combine with price action for confirmation
Adjust parameters during major events (FOMC, earnings)
💎 What Makes This Unique
Beyond Traditional Indicators
Multi-Domain Integration: Only system combining liquidity, macro, crypto, and volatility
Proprietary Calculations: Custom formulas for GLI, Fed, China, and M2 proxies
Adaptive Architecture: Dynamically adjusts to market regimes
Institutional Depth: 20+ integrated metrics vs typical 3-5
Technical Innovation
Statistical Normalization: Custom z-score variants for cross-asset comparison
Correlation Management: Prevents double-counting related signals
Regime Persistence: Algorithms to identify sustainable vs temporary shifts
Visual Intelligence: Information-dense display without overwhelming
🔢 Performance Characteristics
Strengths
Early regime detection (typically 1-3 weeks ahead)
Robust across different market environments
Clear visual feedback reduces interpretation errors
Comprehensive coverage prevents blind spots
Optimal Conditions
Most effective with 100+ bars of history
Best on daily timeframe (4H minimum recommended)
Requires liquid markets for accurate signals
Performance improves with more enabled components
⚠️ Risk Considerations & Limitations
Important Disclaimers
Probabilistic system, not predictive
Requires understanding of macro relationships
Signals should complement other analysis
Past regime behavior doesn't guarantee future patterns
Known Limitations
Black swan events may cause temporary distortions
Central bank interventions can override signals
Requires active management during regime transitions
Not suitable for pure technical traders
💎 Conclusion
The Risk Rotation Matrix represents a new paradigm in market regime analysis. By combining proprietary liquidity calculations with comprehensive multi-domain monitoring, it provides institutional-grade intelligence previously available only to large funds. The system's strength lies not just in its individual components, but in how it synthesizes diverse market information into clear, actionable trading signals.
⚠️ Access & Intellectual Property Notice
This invite-only indicator contains proprietary algorithms, custom calculations, and years of quantitative research. The mathematical formulations for our liquidity proxies, cross-domain correlation matrices, and regime detection algorithms represent significant intellectual property. Access is restricted to protect these innovations and maintain their effectiveness for serious traders who understand the value of comprehensive market regime analysis.

Anchored VWAPs: YTD, MTD, WTD, 2D, DailyTitle
Anchored VWAPs: YTD, MTD, WTD, 2D, Daily
Short Description
Multi-timeframe anchored VWAP indicator displaying Year-to-Date, Month-to-Date, Week-to-Date, 2-Day, and Daily VWAPs that only plot from their respective anchor points.
Full Description
Overview
This indicator provides five different anchored Volume Weighted Average Price (VWAP) calculations for multiple timeframes, designed to behave exactly like TradingView's native Anchored VWAP drawing tool. Each VWAP only plots from its respective anchor point forward, with no historical plotting on previous periods.
Features
Year-to-Date (YTD) AVWAP: Anchored from January 1st of the current year
Month-to-Date (MTD) AVWAP: Anchored from the 1st day of the current month
Week-to-Date (WTD) AVWAP: Anchored from the first day of the current week
2-Day AVWAP: Covers the last 2 business days (excludes weekends)
Daily AVWAP: Anchored from the start of the current trading day
Key Benefits
✅ True Anchoring: Each VWAP only appears from its anchor point - no historical plotting
✅ Current Period Focus: Shows only active/current periods, not historical ones
✅ Business Day Logic: 2-Day AVWAP intelligently handles weekends
✅ Customizable: Toggle each VWAP on/off and customize colors
✅ Visual Anchors: Optional markers show where each period begins
Settings
Display Controls: Individual toggles for each AVWAP
Color Customization: Separate color settings for each line
Line Width: Adjustable line thickness (1-5)
Anchor Markers: Small triangles mark the start of each period
Use Cases
Intraday Trading: Use Daily and 2-Day AVWAPs for short-term support/resistance
Swing Trading: MTD and WTD for medium-term trend analysis
Position Trading: YTD for long-term trend assessment
Multi-Timeframe Analysis: Compare price action across different time horizons
How It Works
The indicator uses timenow to determine the current date and only calculates VWAPs for the active periods. Each VWAP resets at its respective anchor point and accumulates volume-weighted price data from that point forward.
Technical Notes
Uses HLC3 (typical price) for VWAP calculations
Business day logic for 2-Day AVWAP (Monday-Friday only)
Automatic period detection without manual date input
Optimized for real-time trading with current period focus
Best Practices
Use on liquid instruments with significant volume for accurate VWAP calculations
Combine with other technical analysis tools for confirmation
Monitor how price interacts with different timeframe VWAPs for trading opportunities
Tags: VWAP, Anchored VWAP, Volume Analysis, Multi-Timeframe, Support Resistance, Intraday Trading
Category: Volume
This indicator is perfect for traders who want clean, professional anchored VWAPs without the clutter of historical periods, providing clear insight into current market structure across multiple timeframes.
Absorption DetectorABSORPTION DETECTOR -
The Absorption Detector identifies institutional order flow by detecting "absorption" patterns where smart money quietly accumulates or distributes positions by absorbing retail order flow. This creates high-probability support and resistance zones for trading. This is an approximation only and does not read any footprint data.
WHAT IS ABSORPTION?
Absorption occurs when institutions take the opposite side of retail trades, creating specific candlestick patterns with high volume and significant wicks. The indicator identifies two main patterns:
SELLING ABSORPTION (P-Pattern): Red zones above candles where institutions sell into retail buying pressure, creating resistance levels. Look for high volume candles with large upper wicks that close in the lower half.
BUYING ABSORPTION (B-Pattern): Green zones below candles where institutions buy from retail selling pressure, creating support levels. Look for high volume candles with large lower wicks that close in the upper half.
KEY FEATURES
- Automatic detection of institutional absorption patterns
- Dynamic support and resistance zone creation
- Customizable styling for all visual elements
- Historic zone display for backtesting analysis
- Strength-based filtering to show only high-probability setups
- Real-time alerts for new absorption patterns
- Professional info panel with key statistics
- Multi-timeframe compatibility
MAIN SETTINGS
Volume Threshold (1.2): Minimum volume surge required compared to average. Higher values = fewer but stronger signals.
Minimum Volume (2500): Absolute volume floor to prevent signals during low-volume periods.
Min Wick Size (0.2): Minimum wick size as ATR multiple. Ensures significant rejection occurred.
Minimum Strength (1.5): Combined volume and wick strength filter. Higher values = higher quality signals.
Show Historic Zones (OFF): Enable to see all historical zones for backtesting. Disable for better performance.
Zone Extension (20): How many bars to project zones forward for anticipating future reactions.
TRADING APPROACH
ZONE REACTION STRATEGY: Wait for price to approach absorption zones and trade the bounce or rejection. Use the zones as dynamic support and resistance levels.
BREAKOUT STRATEGY: Trade decisive breaks of strong absorption zones with proper risk management. Failed zones often lead to strong moves.
CONFLUENCE TRADING: Combine absorption zones with other technical analysis for highest probability setups. Look for alignment with trend lines, Fibonacci levels, and key support/resistance.
RISK MANAGEMENT: Always use stop losses beyond the absorption zones. Target minimum 1:2 risk-reward ratios. Position size appropriately based on zone strength.
OPTIMIZATION GUIDE
For Conservative Trading (fewer, higher quality signals):
- Volume Threshold: 1.5
- Minimum Strength: 2.0
- Min Wick Size: 0.3
For Aggressive Trading (more signals, requires careful filtering):
- Volume Threshold: 1.1
- Minimum Strength: 1.0
- Min Wick Size: 0.15
BEST PRACTICES
Markets: Works best on liquid instruments with good volume - major forex pairs, popular stocks, liquid futures, and established cryptocurrencies.
Timeframes: Effective on all timeframes from 1-minute scalping to daily swing trading. Adjust settings based on your timeframe and trading style.
Confirmation: Never trade absorption signals in isolation. Always combine with trend analysis, market structure, and proper risk management.
Session Timing: Be aware of market sessions and avoid trading during low liquidity periods or major news events.
Backtesting: Use the historic zones feature to validate performance on your chosen market and timeframe before live trading.
CUSTOMIZATION
The indicator offers complete visual customization including zone colors, border styles, label appearances, and info panel positioning. All colors can be adapted to match your chart theme and personal preferences.
Alert system provides both basic and custom message alerts for real-time notifications of new absorption patterns.
PERFORMANCE NOTES
Default settings are optimized for most markets and timeframes. For best performance on older charts, keep "Show Historic Zones" disabled unless specifically backtesting.
The indicator maintains excellent performance even with extensive historical analysis enabled, handling up to 500 zones and 100 labels for comprehensive backtesting.

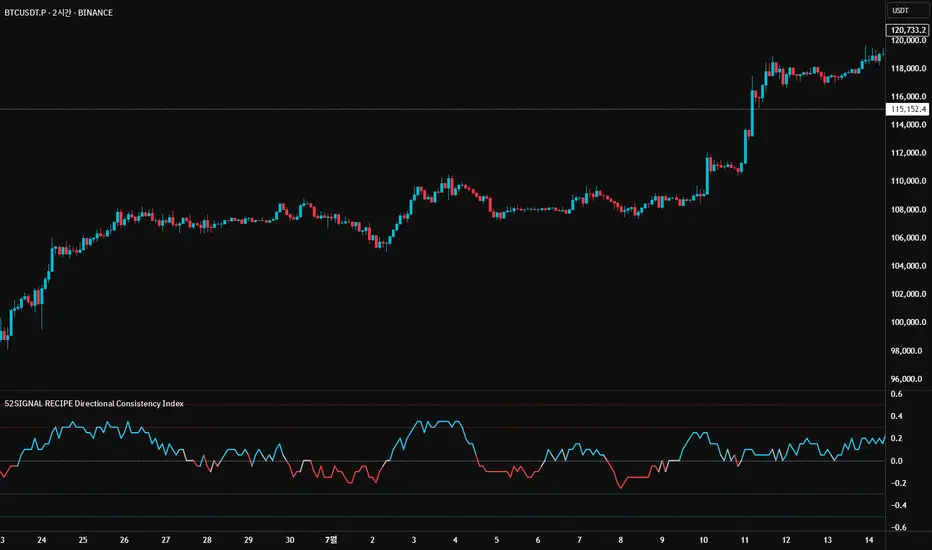
52SIGNAL RECIPE Directional Consistency Index═══ 52SIGNAL RECIPE Directional Consistency Index (DCI) ═══
◆ Overview
52SIGNAL Directional Consistency Index (DCI) is a technical indicator that measures the directional consistency of market movements. This indicator focuses on the consistency of direction rather than the magnitude of price changes, analyzing the strength of market trends and providing more reliable trend analysis by filtering out noise to reflect only meaningful price movements.
─────────────────────────────────────
◆ Key Features
• Direction-Focused Analysis: Concentrates solely on directional consistency rather than magnitude of price changes
• Noise Filtering: Ignores insignificant price movements through minimum percentage change settings
• Trend Exhaustion Detection: Identifies potential trend reversals as values approach ±0.5 levels
• Intuitive Visualization: Instant recognition of trend direction through color changes based on rising/falling zones
• Multi-Market Application: Adaptable to various financial markets including stocks, cryptocurrencies, and forex
─────────────────────────────────────
◆ Technical Foundation
■ Directional Calculation
• Basic Principle: Counts only the up/down movement of each candle to measure directional consistency
• Calculation Method: Determines direction based on percentage change between current close and previous close
• Direction Values: Simplified into Rising (+1), Falling (-1), or Insignificant Change (0)
• Averaging: DCI calculated as the moving average of direction values over the specified period
■ Noise Filtering Mechanism
• Minimum Percentage Change: The minimum percent change required to consider a price movement significant
• Filtering Effect: Movements smaller than the minimum change are excluded from direction calculation (treated as 0)
• Enhanced Reliability: Adjustable filtering strength for optimization across different market environments
─────────────────────────────────────
◆ Practical Applications
■ Trend Identification & Reversal Prediction
• Early Uptrend Detection:
▶ When DCI enters the 0 to +0.3 range
▶ When recent directional consistency begins to consistently rise
• Early Downtrend Detection:
▶ When DCI enters the 0 to -0.3 range
▶ When recent directional consistency begins to consistently fall
• Trend Reversal Signals:
▶ When DCI approaches +0.5 (uptrend exhaustion, potential downward reversal)
▶ When DCI approaches -0.5 (downtrend exhaustion, potential upward reversal)
■ Trading Strategy Implementation
• Trend Following Strategies:
▶ Consider buying when DCI crosses above the 0 line
▶ Consider selling when DCI crosses below the 0 line
• Reversal Trading:
▶ Consider taking profits or short positions when DCI approaches +0.5
▶ Consider long positions when DCI approaches -0.5
• Divergence Confirmation:
▶ Weakening uptrend signal when price rises but DCI weakens
▶ Weakening downtrend signal when price falls but DCI strengthens
─────────────────────────────────────
◆ Advanced Setting Options
■ Period (Length) Settings
• Short-term Analysis: 5-10 days (faster signals, more sensitive responses)
• Medium-term Analysis: 10-20 days (balanced signals, recommended default)
• Long-term Analysis: 20-30 days (slower signals, long-term trend identification)
■ Minimum Percentage Change Settings
• Low Volatility Markets: 0.05-0.2% (suitable for forex markets)
• Medium Volatility Markets: 0.3-0.5% (suitable for stock markets)
• High Volatility Markets: 0.5-1.0% (suitable for cryptocurrency markets)
■ Settings by Trading Style
• Scalping: Lower period (5-10), lower minimum change (0.05-0.1%)
• Day Trading: Medium period (10-15), medium minimum change (0.2-0.3%)
• Swing Trading: Higher period (15-25), higher minimum change (0.3-0.5%)
─────────────────────────────────────
◆ Synergy with Other Indicators
• Moving Averages: Strengthen signals by confirming moving average crossovers when DCI crosses the 0 line
• RSI: Combine DCI trend direction with RSI overbought/oversold levels to confirm entry points
• MACD: Enhance reliability by pairing DCI directional signals with MACD momentum confirmation
• Bollinger Bands: Analyze volatility by checking Bollinger Band expansion/contraction when DCI approaches ±0.5
─────────────────────────────────────
◆ Conclusion
52SIGNAL Directional Consistency Index (DCI) is a powerful tool for objectively measuring market directionality and visualizing trend strength. The noise filtering through minimum percentage change settings can be adjusted to match your trading style and market characteristics for optimal results. Its ability to identify early trend stages and detect overextended zones provides traders with important entry and exit points. When used in conjunction with other technical indicators, it can significantly enhance the reliability of trading decisions.
─────────────────────────────────────
※ Disclaimer: Past performance does not guarantee future results. Always use appropriate risk management strategies.
═══ 52SIGNAL 방향성 일관성 지수 (DCI) ═══
◆ 개요
52SIGNAL 방향성 일관성 지수(DCI)는 시장의 방향성 일관성을 측정하는 기술적 지표입니다. 이 지표는 가격 변화의 크기가 아닌 방향의 일관성에 중점을 두어 시장의 추세 강도를 분석하고, 노이즈 필터링 기능을 통해 의미 있는 가격 변동만을 반영하여 더 신뢰할 수 있는 추세 분석을 제공합니다.
─────────────────────────────────────
◆ 주요 특징
• 방향성 중심 분석: 가격 변화의 크기가 아닌 방향성에만 집중하여 추세의 일관성 측정
• 노이즈 필터링: 최소 변화율 설정을 통해 의미 없는 작은 가격 변동을 무시
• 추세 과열 감지: ±0.5 수준에 접근할 때 추세 전환 가능성 식별
• 직관적인 시각화: 상승/하락 구간에 따른 색상 변화로 추세 방향 즉각 인식
• 다양한 시장 적용: 주식, 암호화폐, 외환 등 다양한 금융 시장에 적용 가능
─────────────────────────────────────
◆ 기술적 기반
■ 방향성 계산
• 기본 원리: 각 캔들의 상승/하락 여부만 카운트하여 방향의 일관성 측정
• 계산 방법: 현재 종가와 이전 종가의 퍼센트 변화를 기준으로 방향 판단
• 방향 값: 상승(+1), 하락(-1), 의미 없는 변화(0)로 단순화
• 평균화: 설정된 기간 동안의 방향 값의 이동평균으로 DCI 산출
■ 노이즈 필터링 메커니즘
• 최소 변화율: 의미 있는 가격 변동으로 인정할 최소 퍼센트 변화
• 필터링 효과: 최소 변화율보다 작은 변동은 방향 계산에서 제외(0으로 처리)
• 신뢰도 향상: 필터링 강도 조절을 통해 다양한 시장 환경에 최적화 가능
─────────────────────────────────────
◆ 실용적 응용
■ 추세 식별 및 전환점 예측
• 상승 추세 초입:
▶ DCI가 0에서 +0.3 사이로 진입할 때
▶ 최근 방향성이 일관되게 상승하기 시작할 때
• 하락 추세 초입:
▶ DCI가 0에서 -0.3 사이로 진입할 때
▶ 최근 방향성이 일관되게 하락하기 시작할 때
• 추세 전환 신호:
▶ DCI가 +0.5에 가까워질 때 (상승 추세 과열, 하락 전환 가능성)
▶ DCI가 -0.5에 가까워질 때 (하락 추세 과열, 상승 전환 가능성)
■ 트레이딩 전략 적용
• 추세 추종 전략:
▶ DCI가 0선을 위로 돌파할 때 매수 고려
▶ DCI가 0선을 아래로 돌파할 때 매도 고려
• 반전 트레이딩:
▶ DCI가 +0.5에 근접할 때 이익실현 또는 매도 포지션 고려
▶ DCI가 -0.5에 근접할 때 매수 포지션 고려
• 다이버전스 확인:
▶ 가격은 상승하나 DCI가 약화될 때 상승 추세 약화 신호
▶ 가격은 하락하나 DCI가 강화될 때 하락 추세 약화 신호
─────────────────────────────────────
◆ 고급 설정 옵션
■ 기간(Length) 설정
• 단기 분석: 5-10일 (빠른 신호, 민감한 반응)
• 중기 분석: 10-20일 (균형 잡힌 신호, 기본 권장)
• 장기 분석: 20-30일 (느린 신호, 장기 추세 식별)
■ 최소 변화율(Minimum % Change) 설정
• 저변동성 시장: 0.05-0.2% (외환 시장에 적합)
• 중변동성 시장: 0.3-0.5% (주식 시장에 적합)
• 고변동성 시장: 0.5-1.0% (암호화폐 시장에 적합)
■ 트레이딩 스타일별 설정
• 스캘핑: 낮은 기간(5-10), 낮은 최소 변화율(0.05-0.1%)
• 데이 트레이딩: 중간 기간(10-15), 중간 최소 변화율(0.2-0.3%)
• 스윙 트레이딩: 높은 기간(15-25), 높은 최소 변화율(0.3-0.5%)
─────────────────────────────────────
◆ 다른 지표와의 시너지
• 이동평균선: DCI가 0선을 돌파할 때 이동평균 교차 확인으로 신호 강화
• RSI: DCI의 추세 방향과 RSI의 과매수/과매도 수준을 결합하여 진입점 확인
• MACD: DCI의 방향성 신호와 MACD의 모멘텀 확인을 결합하여 신뢰도 향상
• 볼린저 밴드: DCI가 ±0.5에 근접할 때 볼린저 밴드 확장/수축 확인으로 변동성 분석
─────────────────────────────────────
◆ 결론
52SIGNAL 방향성 일관성 지수(DCI)는 시장의 방향성을 객관적으로 측정하고 추세의 강도를 시각화하는 강력한 도구입니다. 최소 변화율 설정을 통한 노이즈 필터링은 각자의 트레이딩 성향과 시장 특성에 맞게 조정할 수 있어 최적의 효과를 누릴 수 있습니다. 추세의 초기 단계를 식별하고 과열 구간을 감지하는 능력은 트레이더에게 중요한 진입 및 퇴출 포인트를 제공합니다. 다른 기술적 지표와 함께 사용하면 트레이딩 결정의 신뢰도를 크게 향상시킬 수 있습니다.
─────────────────────────────────────
※ 면책 조항: 과거 성과가 미래 결과를 보장하지 않습니다. 항상 적절한 리스크 관리 전략을 사용하세요.
Fadi ffa **Fadi Dynamic Trend Indicator**
The **Fadi Dynamic Trend Indicator** is a comprehensive technical analysis tool designed to assist traders in identifying trends, key price levels, and potential reversal points across various markets and timeframes. By combining dynamic trend detection, statistical price channel analysis, and advanced reversal point identification, this indicator provides actionable insights for trend-following, breakout, and reversal trading strategies.
**How It Works**:
This indicator integrates three complementary components to deliver clear trading signals and a deeper understanding of market dynamics:
1. **Dynamic Trend Detection**: Utilizes a proprietary algorithm based on the Average True Range (ATR) to calculate dynamic support and resistance levels. It generates Buy and Sell signals when the price crosses these levels, indicating potential trend changes. Traders can customize the trend strength and sensitivity to suit their trading style.
2. **Price Channel Analysis**: Plots a statistical channel based on price regression, highlighting the trend's direction and range. The channel dynamically extends to the right, helping traders identify breakout zones and trend continuation patterns.
3. **Reversal Point Detection**: Identifies significant high and low points in the market, marking them with triangle symbols (▼ for highs, ▲ for lows). Additionally, it highlights "missed" reversal levels (also marked with ▼ and ▲) to indicate potential price zones that have not yet been tested, offering unique insights into untapped market opportunities.
**How to Use**:
- **Timeframes**: The indicator performs well on various timeframes, with optimal results on 15-minute to 1-hour charts for scalping or swing trading.
- **Signals**: Look for Buy (green "BUY" label below the bar) and Sell (red "SELL" label above the bar) signals to enter trades, ideally confirmed by price action within the price channel or near reversal points.
- **Reversal Points**: Monitor the ▼ (highs) and ▲ (lows) labels to identify key reversal zones. The "missed" levels (also shown as ▼ and ▲) indicate potential areas where the price may react in the future.
- **Customization**:
- **Trend Signal Strength** (default: 1): Adjusts the ATR period to control the frequency of trend signals.
- **Trend Sensitivity** (default: 0.8): Fine-tunes the responsiveness of the trend lines.
- **Reversal Signal Sensitivity** (default: 7): Defines the lookback period for detecting reversal points.
- **Price Channel Length** (default: 100): Sets the period for calculating the price channel.
- Use the indicator on standard candlestick charts for accurate results.
**Unique Features**:
- **Integrated Analysis**: Combines trend detection, price channel analysis, and reversal point identification into a single, cohesive tool.
- **Missed Reversal Levels**: Highlights untested price levels with ▼ and ▲ symbols, helping traders anticipate potential price reactions before they occur.
- **Dynamic Customization**: Offers adjustable settings to adapt the indicator to different markets (stocks, forex, crypto) and trading strategies (scalping, day trading, or swing trading).
- **Efficient Design**: Optimized to minimize resource usage, ensuring smooth performance on TradingView charts.
**Settings**:
- **Trend Signal Strength**: Controls the ATR period for trend calculations (default: 1).
- **Trend Sensitivity**: Adjusts the sensitivity of trend signals (default: 0.8).
- **Reversal Signal Sensitivity**: Defines the lookback period for reversal point detection (default: 7).
- **Price Channel Length**: Sets the period for the statistical price channel (default: 100).
**Trading Tips**:
- For scalping, use shorter timeframes (5-15 minutes) and increase the Trend Sensitivity for more frequent signals.
- For swing trading, use higher timeframes (1-hour or 4-hour) and adjust the Reversal Signal Sensitivity to focus on significant reversal points.
- Combine Buy/Sell signals with price channel breakouts or interactions with reversal levels for higher-probability trades.
- Monitor the correlation coefficient (displayed below the chart) to gauge the strength of the trend within the price channel.
**Why Use This Indicator?**
The Fadi Dynamic Trend Indicator is ideal for traders seeking a versatile tool that simplifies complex market analysis. Its unique combination of trend signals, price channel visualization, and missed reversal levels empowers traders to make informed decisions in trending or ranging markets. Whether you're a beginner or an experienced trader, this indicator provides clear, actionable insights to enhance your trading strategy.
**Note**: This indicator is designed for use on standard candlestick charts to ensure realistic and reliable results. Always backtest and validate the indicator on your preferred market and timeframe before using it in live trading.
Active PMI Support/Resistance Levels [EdgeTerminal]The PMI Support & Resistance indicator revolutionizes traditional technical analysis by using Pointwise Mutual Information (PMI) - a statistical measure from information theory - to objectively identify support and resistance levels. Unlike conventional methods that rely on visual pattern recognition, this indicator provides mathematically rigorous, quantifiable evidence of price levels where significant market activity occurs.
- The Mathematical Foundation: Pointwise Mutual Information
Pointwise Mutual Information measures how much more likely two events are to occur together compared to if they were statistically independent. In our context:
Event A: Volume spikes occurring (high trading activity)
Event B: Price being at specific levels
The PMI formula calculates: PMI = log(P(A,B) / (P(A) × P(B)))
Where:
P(A,B) = Probability of volume spikes occurring at specific price levels
P(A) = Probability of volume spikes occurring anywhere
P(B) = Probability of price being at specific levels
High PMI scores indicate that volume spikes and certain price levels co-occur much more frequently than random chance would predict, revealing genuine support and resistance zones.
- Why PMI Outperforms Traditional Methods
Subjective interpretation: What one trader sees as significant, another might ignore
Confirmation bias: Tendency to see patterns that confirm existing beliefs
Inconsistent criteria: No standardized definition of "significant" volume or price action
Static analysis: Doesn't adapt to changing market conditions
No strength measurement: Can't quantify how "strong" a level truly is
PMI Advantages:
✅ Objective & Quantifiable: Mathematical proof of significance, not visual guesswork
✅ Statistical Rigor: Levels backed by information theory and probability
✅ Strength Scoring: PMI scores rank levels by statistical significance
✅ Adaptive: Automatically adjusts to different market volatility regimes
✅ Eliminates Bias: Computer-calculated, removing human interpretation errors
✅ Market Structure Aware: Reveals the underlying order flow concentrations
- How It Works
Data Processing Pipeline:
Volume Analysis: Identifies volume spikes using configurable thresholds
Price Binning: Divides price range into discrete levels for analysis
Co-occurrence Calculation: Measures how often volume spikes happen at each price level
PMI Computation: Calculates statistical significance for each price level
Level Filtering: Shows only levels exceeding minimum PMI thresholds
Dynamic Updates: Refreshes levels periodically while maintaining historical traces
Visual System:
Current Levels: Bright, thick lines with PMI scores - your actionable levels
Historical Traces: Faded previous levels showing market structure evolution
Strength Tiers: Line styles indicate PMI strength (solid/dashed/dotted)
Color Coding: Green for support, red for resistance
Info Table: Real-time display of strongest levels with scores
- Indicator Settings:
Core Parameters
Lookback Period (Default: 200)
Lower (50-100): More responsive to recent price action, catches short-term levels
Higher (300-500): Focuses on major historical levels, more stable but less responsive
Best for: Day trading (100-150), Swing trading (200-300), Position trading (400-500)
Volume Spike Threshold (Default: 1.5)
Lower (1.2-1.4): More sensitive, catches smaller volume increases, more levels detected
Higher (2.0-3.0): Only major volume surges count, fewer but stronger signals
Market dependent: High-volume stocks may need higher thresholds (2.0+), low-volume stocks lower (1.2-1.3)
Price Bins (Default: 50)
Lower (20-30): Broader price zones, less precise but captures wider areas
Higher (70-100): More granular levels, precise but may be overly specific
Volatility dependent: High volatility assets benefit from more bins (70+)
Minimum PMI Score (Default: 0.5)
Lower (0.2-0.4): Shows more levels including weaker ones, comprehensive view
Higher (1.0-2.0): Only statistically strong levels, cleaner chart
Progressive filtering: Start with 0.5, increase if too cluttered
Max Levels to Show (Default: 8)
Fewer (3-5): Clean chart focusing on strongest levels only
More (10-15): Comprehensive view but may clutter chart
Strategy dependent: Scalpers prefer fewer (3-5), swing traders more (8-12)
Historical Tracking Settings
Update Frequency (Default: 20 bars)
Lower (5-10): More frequent updates, captures rapid market changes
Higher (50-100): Less frequent updates, focuses on major structural shifts
Timeframe scaling: 1-minute charts need lower frequency (5-10), daily charts higher (50+)
Show Historical Levels (Default: True)
Enables the "breadcrumb trail" effect showing evolution of support/resistance
Disable for cleaner charts focusing only on current levels
Max Historical Marks (Default: 50)
Lower (20-30): Less memory usage, shorter history
Higher (100-200): Longer historical context but more resource intensive
Fade Strength (Default: 0.8)
Lower (0.5-0.6): Historical levels more visible
Higher (0.9-0.95): Historical levels very subtle
Visual Settings
Support/Resistance Colors: Choose colors that contrast well with your chart theme Line Width: Thicker lines (3-4) for better visibility on busy charts Show PMI Scores: Toggle labels showing statistical strength Label Size: Adjust based on screen resolution and chart zoom level
- Most Effective Usage Strategies
For Day Trading:
Setup: Lookback 100-150, Volume Threshold 1.8-2.2, Update Frequency 10-15
Use PMI levels as bounce/rejection points for scalp entries
Higher PMI scores (>1.5) offer better probability setups
Watch for volume spike confirmations at levels
For Swing Trading:
Setup: Lookback 200-300, Volume Threshold 1.5-2.0, Update Frequency 20-30
Enter on pullbacks to high PMI support levels
Target next resistance level with PMI score >1.0
Hold through minor levels, exit at major PMI levels
For Position Trading:
Setup: Lookback 400-500, Volume Threshold 2.0+, Update Frequency 50+
Focus on PMI scores >2.0 for major structural levels
Use for portfolio entry/exit decisions
Combine with fundamental analysis for timing
- Trading Applications:
Entry Strategies:
PMI Bounce Trades
Price approaches high PMI support level (>1.0)
Wait for volume spike confirmation (orange triangles)
Enter long on bullish price action at the level
Stop loss just below the PMI level
Target: Next PMI resistance level
PMI Breakout Trades
Price consolidates near high PMI level
Volume increases (watch for orange triangles)
Enter on decisive break with volume
Previous resistance becomes new support
Target: Next major PMI level
PMI Rejection Trades
Price approaches PMI resistance with momentum
Watch for rejection signals and volume spikes
Enter short on failure to break through
Stop above the PMI level
Target: Next PMI support level
Risk Management:
Stop Loss Placement
Place stops 0.1-0.5% beyond PMI levels (adjust for volatility)
Higher PMI scores warrant tighter stops
Use ATR-based stops for volatile assets
Position Sizing
Larger positions at PMI levels >2.0 (highest conviction)
Smaller positions at PMI levels 0.5-1.0 (lower conviction)
Scale out at multiple PMI targets
- Key Warning Signs & What to Watch For
Red Flags:
🚨 Very Low PMI Scores (<0.3): Weak statistical significance, avoid trading
🚨 No Volume Confirmation: PMI level without recent volume spikes may be stale
🚨 Overcrowded Levels: Too many levels close together suggests poor parameter tuning
🚨 Outdated Levels: Historical traces are reference only, not tradeable
Optimization Tips:
✅ Regular Recalibration: Adjust parameters monthly based on market regime changes
✅ Volume Context: Always check for recent volume activity at PMI levels
✅ Multiple Timeframes: Confirm PMI levels across different timeframes
✅ Market Conditions: Higher thresholds during high volatility periods
Interpreting PMI Scores
PMI Score Ranges:
0.5-1.0: Moderate statistical significance, proceed with caution
1.0-1.5: Good significance, reliable for most trading strategies
1.5-2.0: Strong significance, high-confidence trade setups
2.0+: Very strong significance, institutional-grade levels
Historical Context: The historical trace system shows how support and resistance evolve over time. When current levels align with multiple historical traces, it indicates persistent market memory at those prices, significantly increasing the level's reliability.

Chaikin Money Flow (CMF) [ParadoxAlgo]OVERVIEW
This indicator implements the Chaikin Money Flow oscillator as an overlay on the price chart, designed to help traders identify institutional money flow patterns. The Chaikin Money Flow combines price and volume data to measure the flow of money into and out of a security, making it particularly useful for detecting accumulation and distribution phases.
WHAT IS CHAIKIN MONEY FLOW?
Chaikin Money Flow was developed by Marc Chaikin and measures the amount of Money Flow Volume over a specific period. The indicator oscillates between +1 and -1, where:
Positive values indicate money flowing into the security (accumulation)
Negative values indicate money flowing out of the security (distribution)
Values near zero suggest equilibrium between buying and selling pressure
CALCULATION METHOD
Money Flow Multiplier = ((Close - Low) - (High - Close)) / (High - Low)
Money Flow Volume = Money Flow Multiplier × Volume
CMF = Sum of Money Flow Volume over N periods / Sum of Volume over N periods
KEY FEATURES
Big Money Detection:
Identifies significant institutional activity when CMF exceeds user-defined thresholds
Requires volume confirmation (volume above average) to validate signals
Uses battery icon (🔋) for institutional buying and lightning icon (⚡) for institutional selling
Visual Elements:
Background coloring based on money flow direction
Support and resistance levels calculated using Average True Range
Real-time dashboard showing current CMF value, volume strength, and signal status
Customizable Parameters:
CMF Period: Calculation period for the money flow (default: 20)
Signal Smoothing: EMA smoothing applied to reduce noise (default: 5)
Big Money Threshold: CMF level required to trigger institutional signals (default: 0.15)
Volume Threshold: Volume multiplier required for signal confirmation (default: 1.5x)
INTERPRETATION
Signal Types:
🔋 (Battery): Indicates strong institutional buying when CMF > threshold with high volume
⚡ (Lightning): Indicates strong institutional selling when CMF < -threshold with high volume
Background color: Green tint for positive money flow, red tint for negative money flow
Dashboard Information:
CMF Value: Current Chaikin Money Flow reading
Volume: Current volume as a multiple of 20-period average
Big Money: Status of institutional activity (BUYING/SELLING/QUIET)
Signal: Strength assessment (STRONG/MEDIUM/WEAK)
TRADING APPLICATIONS
Trend Confirmation: Use CMF direction to confirm price trends
Divergence Analysis: Look for divergences between price and money flow
Volume Validation: Confirm breakouts with corresponding money flow
Accumulation/Distribution: Identify phases of institutional activity
PARAMETER RECOMMENDATIONS
Day Trading: CMF Period 14-21, higher sensitivity settings
Swing Trading: CMF Period 20-30, moderate sensitivity
Position Trading: CMF Period 30-50, lower sensitivity for major trends
ALERTS
Optional alert system notifies users when:
Big money buying is detected (CMF above threshold with volume confirmation)
Big money selling is detected (CMF below negative threshold with volume confirmation)
LIMITATIONS
May generate false signals in low-volume conditions
Best used in conjunction with other technical analysis tools
Effectiveness varies across different market conditions and timeframes
EDUCATIONAL PURPOSE
This open-source indicator is provided for educational purposes to help traders understand money flow analysis. It demonstrates the practical application of the Chaikin Money Flow concept with visual enhancements for easier interpretation.
TECHNICAL SPECIFICATIONS
Overlay indicator (displays on price chart)
No repainting - all calculations are based on closed bar data
Suitable for all timeframes and asset classes
Minimal resource usage for optimal performance
DISCLAIMER
This indicator is for educational and informational purposes only. Past performance does not guarantee future results. Always conduct your own analysis and consider risk management before making trading decisions.

Aetherium Institutional Market Resonance EngineAetherium Institutional Market Resonance Engine (AIMRE)
A Three-Pillar Framework for Decoding Institutional Activity
🎓 THEORETICAL FOUNDATION
The Aetherium Institutional Market Resonance Engine (AIMRE) is a multi-faceted analysis system designed to move beyond conventional indicators and decode the market's underlying structure as dictated by institutional capital flow. Its philosophy is built on a singular premise: significant market moves are preceded by a convergence of context , location , and timing . Aetherium quantifies these three dimensions through a revolutionary three-pillar architecture.
This system is not a simple combination of indicators; it is an integrated engine where each pillar's analysis feeds into a central logic core. A signal is only generated when all three pillars achieve a state of resonance, indicating a high-probability alignment between market organization, key liquidity levels, and cyclical momentum.
⚡ THE THREE-PILLAR ARCHITECTURE
1. 🌌 PILLAR I: THE COHERENCE ENGINE (THE 'CONTEXT')
Purpose: To measure the degree of organization within the market. This pillar answers the question: " Is the market acting with a unified purpose, or is it chaotic and random? "
Conceptual Framework: Institutional campaigns (accumulation or distribution) create a non-random, organized market environment. Retail-driven or directionless markets are characterized by "noise" and chaos. The Coherence Engine acts as a filter to ensure we only engage when institutional players are actively steering the market.
Formulaic Concept:
Coherence = f(Dominance, Synchronization)
Dominance Factor: Calculates the absolute difference between smoothed buying pressure (volume-weighted bullish candles) and smoothed selling pressure (volume-weighted bearish candles), normalized by total pressure. A high value signifies a clear winner between buyers and sellers.
Synchronization Factor: Measures the correlation between the streams of buying and selling pressure over the analysis window. A high positive correlation indicates synchronized, directional activity, while a negative correlation suggests choppy, conflicting action.
The final Coherence score (0-100) represents the percentage of market organization. A high score is a prerequisite for any signal, filtering out unpredictable market conditions.
2. 💎 PILLAR II: HARMONIC LIQUIDITY MATRIX (THE 'LOCATION')
Purpose: To identify and map high-impact institutional footprints. This pillar answers the question: " Where have institutions previously committed significant capital? "
Conceptual Framework: Large institutional orders leave indelible marks on the market in the form of anomalous volume spikes at specific price levels. These are not random occurrences but are areas of intense historical interest. The Harmonic Liquidity Matrix finds these footprints and consolidates them into actionable support and resistance zones called "Harmonic Nodes."
Algorithmic Process:
Footprint Identification: The engine scans the historical lookback period for candles where volume > average_volume * Institutional_Volume_Filter. This identifies statistically significant volume events.
Node Creation: A raw node is created at the mean price of the identified candle.
Dynamic Clustering: The engine uses an ATR-based proximity algorithm. If a new footprint is identified within Node_Clustering_Distance (ATR) of an existing Harmonic Node, it is merged. The node's price is volume-weighted, and its magnitude is increased. This prevents chart clutter and consolidates nearby institutional orders into a single, more significant level.
Node Decay: Nodes that are older than the Institutional_Liquidity_Scanback period are automatically removed from the chart, ensuring the analysis remains relevant to recent market dynamics.
3. 🌊 PILLAR III: CYCLICAL RESONANCE MATRIX (THE 'TIMING')
Purpose: To identify the market's dominant rhythm and its current phase. This pillar answers the question: " Is the market's immediate energy flowing up or down? "
Conceptual Framework: Markets move in waves and cycles of varying lengths. Trading in harmony with the current cyclical phase dramatically increases the probability of success. Aetherium employs a simplified wavelet analysis concept to decompose price action into short, medium, and long-term cycles.
Algorithmic Process:
Cycle Decomposition: The engine calculates three oscillators based on the difference between pairs of Exponential Moving Averages (e.g., EMA8-EMA13 for short cycle, EMA21-EMA34 for medium cycle).
Energy Measurement: The 'energy' of each cycle is determined by its recent volatility (standard deviation). The cycle with the highest energy is designated as the "Dominant Cycle."
Phase Analysis: The engine determines if the dominant cycles are in a bullish phase (rising from a trough) or a bearish phase (falling from a peak).
Cycle Sync: The highest conviction timing signals occur when multiple cycles (e.g., short and medium) are synchronized in the same direction, indicating broad-based momentum.
🔧 COMPREHENSIVE INPUT SYSTEM
Pillar I: Market Coherence Engine
Coherence Analysis Window (10-50, Default: 21): The lookback period for the Coherence Engine.
Lower Values (10-15): Highly responsive to rapid shifts in market control. Ideal for scalping but can be sensitive to noise.
Balanced (20-30): Excellent for day trading, capturing the ebb and flow of institutional sessions.
Higher Values (35-50): Smoother, more stable reading. Best for swing trading and identifying long-term institutional campaigns.
Coherence Activation Level (50-90%, Default: 70%): The minimum market organization required to enable signal generation.
Strict (80-90%): Only allows signals in extremely clear, powerful trends. Fewer, but potentially higher quality signals.
Standard (65-75%): A robust filter that effectively removes choppy conditions while capturing most valid institutional moves.
Lenient (50-60%): Allows signals in less-organized markets. Can be useful in ranging markets but may increase false signals.
Pillar II: Harmonic Liquidity Matrix
Institutional Liquidity Scanback (100-400, Default: 200): How far back the engine looks for institutional footprints.
Short (100-150): Focuses on recent institutional activity, providing highly relevant, immediate levels.
Long (300-400): Identifies major, long-term structural levels. These nodes are often extremely powerful but may be less frequent.
Institutional Volume Filter (1.3-3.0, Default: 1.8): The multiplier for detecting a volume spike.
High (2.5-3.0): Only registers climactic, undeniable institutional volume. Fewer, but more significant nodes.
Low (1.3-1.7): More sensitive, identifying smaller but still relevant institutional interest.
Node Clustering Distance (0.2-0.8 ATR, Default: 0.4): The ATR-based distance for merging nearby nodes.
High (0.6-0.8): Creates wider, more consolidated zones of liquidity.
Low (0.2-0.3): Creates more numerous, precise, and distinct levels.
Pillar III: Cyclical Resonance Matrix
Cycle Resonance Analysis (30-100, Default: 50): The lookback for determining cycle energy and dominance.
Short (30-40): Tunes the engine to faster, shorter-term market rhythms. Best for scalping.
Long (70-100): Aligns the timing component with the larger primary trend. Best for swing trading.
Institutional Signal Architecture
Signal Quality Mode (Professional, Elite, Supreme): Controls the strictness of the three-pillar confluence.
Professional: Loosest setting. May generate signals if two of the three pillars are in strong alignment. Increases signal frequency.
Elite: Balanced setting. Requires a clear, unambiguous resonance of all three pillars. The recommended default.
Supreme: Most stringent. Requires perfect alignment of all three pillars, with each pillar exhibiting exceptionally strong readings (e.g., coherence > 85%). The highest conviction signals.
Signal Spacing Control (5-25, Default: 10): The minimum bars between signals to prevent clutter and redundant alerts.
🎨 ADVANCED VISUAL SYSTEM
The visual architecture of Aetherium is designed not merely for aesthetics, but to provide an intuitive, at-a-glance understanding of the complex data being processed.
Harmonic Liquidity Nodes: The core visual element. Displayed as multi-layered, semi-transparent horizontal boxes.
Magnitude Visualization: The height and opacity of a node's "glow" are proportional to its volume magnitude. More significant nodes appear brighter and larger, instantly drawing the eye to key levels.
Color Coding: Standard nodes are blue/purple, while exceptionally high-magnitude nodes are highlighted in an accent color to denote critical importance.
🌌 Quantum Resonance Field: A dynamic background gradient that visualizes the overall market environment.
Color: Shifts from cool blues/purples (low coherence) to energetic greens/cyans (high coherence and organization), providing instant context.
Intensity: The brightness and opacity of the field are influenced by total market energy (a composite of coherence, momentum, and volume), making powerful market states visually apparent.
💎 Crystalline Lattice Matrix: A geometric web of lines projected from a central moving average.
Mathematical Basis: Levels are projected using multiples of the Golden Ratio (Phi ≈ 1.618) and the ATR. This visualizes the natural harmonic and fractal structure of the market. It is not arbitrary but is based on mathematical principles of market geometry.
🧠 Synaptic Flow Network: A dynamic particle system visualizing the engine's "thought process."
Node Density & Activation: The number of particles and their brightness/color are tied directly to the Market Coherence score. In high-coherence states, the network becomes a dense, bright, and organized web. In chaotic states, it becomes sparse and dim.
⚡ Institutional Energy Waves: Flowing sine waves that visualize market volatility and rhythm.
Amplitude & Speed: The height and speed of the waves are directly influenced by the ATR and volume, providing a feel for market energy.
📊 INSTITUTIONAL CONTROL MATRIX (DASHBOARD)
The dashboard is the central command console, providing a real-time, quantitative summary of each pillar's status.
Header: Displays the script title and version.
Coherence Engine Section:
State: Displays a qualitative assessment of market organization: ◉ PHASE LOCK (High Coherence), ◎ ORGANIZING (Moderate Coherence), or ○ CHAOTIC (Low Coherence). Color-coded for immediate recognition.
Power: Shows the precise Coherence percentage and a directional arrow (↗ or ↘) indicating if organization is increasing or decreasing.
Liquidity Matrix Section:
Nodes: Displays the total number of active Harmonic Liquidity Nodes currently being tracked.
Target: Shows the price level of the nearest significant Harmonic Node to the current price, representing the most immediate institutional level of interest.
Cycle Matrix Section:
Cycle: Identifies the currently dominant market cycle (e.g., "MID ") based on cycle energy.
Sync: Indicates the alignment of the cyclical forces: ▲ BULLISH , ▼ BEARISH , or ◆ DIVERGENT . This is the core timing confirmation.
Signal Status Section:
A unified status bar that provides the final verdict of the engine. It will display "QUANTUM SCAN" during neutral periods, or announce the tier and direction of an active signal (e.g., "◉ TIER 1 BUY ◉" ), highlighted with the appropriate color.
🎯 SIGNAL GENERATION LOGIC
Aetherium's signal logic is built on the principle of strict, non-negotiable confluence.
Condition 1: Context (Coherence Filter): The Market Coherence must be above the Coherence Activation Level. No signals can be generated in a chaotic market.
Condition 2: Location (Liquidity Node Interaction): Price must be actively interacting with a significant Harmonic Liquidity Node.
For a Buy Signal: Price must be rejecting the Node from below (testing it as support).
For a Sell Signal: Price must be rejecting the Node from above (testing it as resistance).
Condition 3: Timing (Cycle Alignment): The Cyclical Resonance Matrix must confirm that the dominant cycles are synchronized with the intended trade direction.
Signal Tiering: The Signal Quality Mode input determines how strictly these three conditions must be met. 'Supreme' mode, for example, might require not only that the conditions are met, but that the Market Coherence is exceptionally high and the interaction with the Node is accompanied by a significant volume spike.
Signal Spacing: A final filter ensures that signals are spaced by a minimum number of bars, preventing over-alerting in a single move.
🚀 ADVANCED TRADING STRATEGIES
The Primary Confluence Strategy: The intended use of the system. Wait for a Tier 1 (Elite/Supreme) or Tier 2 (Professional/Elite) signal to appear on the chart. This represents the alignment of all three pillars. Enter after the signal bar closes, with a stop-loss placed logically on the other side of the Harmonic Node that triggered the signal.
The Coherence Context Strategy: Use the Coherence Engine as a standalone market filter. When Coherence is high (>70%), favor trend-following strategies. When Coherence is low (<50%), avoid new directional trades or favor range-bound strategies. A sharp drop in Coherence during a trend can be an early warning of a trend's exhaustion.
Node-to-Node Trading: In a high-coherence environment, use the Harmonic Liquidity Nodes as both entry points and profit targets. For example, after a BUY signal is generated at one Node, the next Node above it becomes a logical first profit target.
⚖️ RESPONSIBLE USAGE AND LIMITATIONS
Decision Support, Not a Crystal Ball: Aetherium is an advanced decision-support tool. It is designed to identify high-probability conditions based on a model of institutional behavior. It does not predict the future.
Risk Management is Paramount: No indicator can replace a sound risk management plan. Always use appropriate position sizing and stop-losses. The signals provided are probabilistic, not certainties.
Past Performance Disclaimer: The market models used in this script are based on historical data. While robust, there is no guarantee that these patterns will persist in the future. Market conditions can and do change.
Not a "Set and Forget" System: The indicator performs best when its user understands the concepts behind the three pillars. Use the dashboard and visual cues to build a comprehensive view of the market before acting on a signal.
Backtesting is Essential: Before applying this tool to live trading, it is crucial to backtest and forward-test it on your preferred instruments and timeframes to understand its unique behavior and characteristics.
🔮 CONCLUSION
The Aetherium Institutional Market Resonance Engine represents a paradigm shift from single-variable analysis to a holistic, multi-pillar framework. By quantifying the abstract concepts of market context, location, and timing into a unified, logical system, it provides traders with an unprecedented lens into the mechanics of institutional market operations.
It is not merely an indicator, but a complete analytical engine designed to foster a deeper understanding of market dynamics. By focusing on the core principles of institutional order flow, Aetherium empowers traders to filter out market noise, identify key structural levels, and time their entries in harmony with the market's underlying rhythm.
"In all chaos there is a cosmos, in all disorder a secret order." - Carl Jung
— Dskyz, Trade with insight. Trade with confluence. Trade with Aetherium.

TPO[Fixed Range, Anchored, Bars Back]TPO Bars Back, Fixed Range and Anchored
Overview
The TPO Profile (Time Price Opportunity Profile) is a powerful market profile indicator that displays the amount of time price spent at different levels during a specified period. Unlike traditional volume profile indicators that show volume distribution, TPO Profile shows time distribution , providing insights into where price has spent the most time and identifying key support and resistance levels.
Key Advantages Over TradingView's Built-in TPO
Simplified Composite Creation : Automatically creates TPO profiles for any time range without manual split/merge operations
Instant Value Area Calculation : Immediately shows Value Area, POC, VAH, and VAL for your selected period
No Manual Assembly Required : TradingView's native TPO requires you to manually split sessions and merge them to create composites - this indicator does it automatically
Flexible Time Ranges : Create composites for any custom time period (multiple days, weeks, specific events) with a few clicks
Real-time Composite Updates : Anchor mode creates live composites that update as new data arrives
Multiple Composite Analysis : Easily compare different time periods without the tedious manual process
Key Features
Core Functionality
Time-Based Analysis : Shows time spent at each price level rather than volume
Configurable Time Blocks : Use any timeframe for TPO counting (30min, 1H, 4H, etc.)
Multiple Price Levels : Adjustable from 5 to 200 levels for granular analysis
Point of Control (POC) : Automatically identifies the price level with highest time activity
Value Area Calculation : Shows the price range containing 70% (configurable) of time activity
Automatic Composite Generation : Creates multi-session composites without manual intervention
Three Operating Modes
1. Bars Back Mode
Analyzes the last N bars from the current bar
Perfect for recent market activity analysis
Range: 10-500 bars
Use Case : Intraday analysis, recent session review
2. Fixed Range Mode
Analyzes a specific time period between start and end times
Ideal for historical analysis of specific events
Creates perfect composites for multi-day periods
Use Case : Earnings periods, news events, specific trading sessions, weekly/monthly composites
3. Anchor Mode (NEW)
Starts from a specific time and extends to the current bar
Dynamically updates as new bars form
Perfect for building live composites from any starting point
Use Case : Live session monitoring, event-based analysis from a specific point, growing composites
Visual Elements
TPO Bars
Horizontal bars showing time distribution at each price level
Longer bars = more time spent at that level
Color-coded to distinguish Value Area from outlying levels
Point of Control (POC)
Red line marking the price level with highest time activity
Most significant support/resistance level
Configurable line style (Solid/Dashed/Dotted) and width
Value Area High/Low (VAH/VAL)
Green and Orange lines marking the boundaries of the Value Area
Shows the price range containing the specified percentage of time activity
Optional display with customizable line styles
Single Print Detection
Identifies price levels touched by only one time block
Display options: Lines or Boxes
Purple color highlighting these significant levels
Often act as strong support/resistance in future trading
Customization Options
Time Block Configuration
Block Time : Choose timeframe for TPO counting (30min, 1H, 4H, etc.)
Allows analysis at different time granularities
Higher timeframes = broader perspective, Lower timeframes = finer detail
Visual Styling
Line Styles : Solid, Dashed, or Dotted for all line elements
Line Widths : 1-5 pixels for POC, VAH, and VAL lines
Colors : Fully customizable colors for all elements
Transparency : Adjustable transparency for better chart readability
Label Management
Show/Hide Labels : Toggle POC, VAH, VAL labels
Font Sizes : Tiny, Small, Normal, Large, Huge
Label Positioning : 8 different position options relative to lines
Offset Controls : Fine-tune label positioning
Line Extension
Level Offset Right : Controls how far lines extend
Smart extension logic:
Value ≤ 0: Infinite extension (extend.right)
Value ≥ 1: Extends exactly N bars ahead
Trading Applications
Support & Resistance
POC often acts as strong support/resistance
Value Area boundaries provide key levels
Single prints frequently become significant levels
Market Structure Analysis
Identify areas of price acceptance (thick TPO bars)
Spot areas of price rejection (thin TPO bars)
Understand where market participants are comfortable trading
Composite Profile Analysis
Create multi-day, weekly, or monthly composites instantly
Compare different composite periods without manual work
Analyze longer-term price acceptance levels
Build composites around specific events or announcements
Session Analysis
Monitor intraday session development in real-time
Compare different sessions (London, New York, Asia)
Track how profiles change throughout the trading day
Build live composites across multiple sessions
Event Analysis
Use Fixed Range mode for earnings, news events
Use Anchor mode to track price development from specific events
Compare pre/post event price acceptance levels
Create event-based composites automatically
Input Parameters
Mode Selection
Mode : Bars Back | Fixed Range | Anchor
Bars Back : Number of bars to analyze (10-500)
Start Time : Beginning time for Fixed Range and Anchor modes
End Time : Ending time for Fixed Range mode only
Analysis Configuration
Block Time : Timeframe for TPO blocks (e.g., "30" for 30-minute blocks)
TPO Levels : Number of price levels (5-200)
Value Area % : Percentage for Value Area calculation (50-95%)
Display Options
Show POC : Display Point of Control line
Show Value Area : Display Value Area box
Show VAH/VAL Lines : Display Value Area boundary lines
Show Single Prints : Display single print detection
Single Print Style : Lines or Boxes
Styling Controls
Colors : TPO, POC, Value Area, VAH, VAL, Single Print colors
Line Styles : POC, VAH, VAL line styles
Line Widths : POC, VAH, VAL line widths
Labels : Show/hide, font size, position, offset controls
Technical Details
Calculation Method
Divides the price range into equal levels based on TPO Levels setting
For each time block, determines which price levels it crosses
Adds +1 count to each crossed level
Identifies POC as the level with highest count
Calculates Value Area by expanding from POC until target percentage is reached
Performance Considerations
Historical data limited to prevent buffer overflow errors
Smart bounds checking for different timeframes
Optimized cleanup routines to prevent drawing object accumulation
Pine Script Version
Built on Pine Script v6
Uses modern Pine Script best practices
Efficient array handling and drawing object management
Best Practices
Timeframe Selection
Block Time = Chart Timeframe : Traditional TPO approach
Block Time > Chart Timeframe : Smoother, broader perspective
Block Time < Chart Timeframe : More granular, detailed analysis
Level Count Guidelines
Low levels (10-20) : Better for swing trading, major levels
High levels (50-100) : Better for scalping, precise entries
Very high levels (100+) : For very detailed analysis
Mode Selection
Bars Back : Daily analysis, recent activity
Fixed Range : Historical events, specific periods, manual composites
Anchor : Live monitoring, event-based analysis, growing composites
Composite Creation Workflow
Select Fixed Range or Anchor mode
Set your desired start time (and end time for Fixed Range)
Adjust TPO Levels for desired granularity
Enable VAH/VAL lines to see Value Area boundaries
The composite profile generates automatically with all key levels
This indicator eliminates the tedious manual process of creating composite TPO profiles in TradingView. Instead of splitting sessions and manually merging them, you get instant composite analysis with automatic Value Area calculation, POC identification, and single print detection. The combination of time-based analysis, multiple operating modes, and extensive customization options makes it a powerful tool for understanding market structure and price acceptance levels across any time period.

Supply & Demand MTF[E7T]This is not your average supply and demand tool. it’s a powerful, flexible indicator that helps traders spot high-probability opportunities by adapting to real-time market conditions. It uses a smart combination of volatility (ATR), volume, and price action to identify key zones where the market is likely to react. Perfect for scalpers and swing traders alike, this strategy brings together adaptive zone detection, trend bias (pivot line), two-tiered signals (S1 and S2), volume filtering, built-in Fibonacci targets, and even a debug mode for transparency and performance tracking.
KEY FEATURES
1. ADAPTIVE ZONE DETECTION; This feature highlights areas where price is likely to bounce or reversebullish demand zones and bearish supply zones. Instead of using fixed levels, it adjusts based on market volatility.
HOW IT WORKS:
Uses Average True Range (ATR) to measure volatility.
TWO MODES:
Low Volatility Mode: Makes zones tighter for calm markets.
High Volatility Mode: Expands zones during choppy or fast-moving conditions.
Plots red boxes for supply zones and blue for demand zones. Zones extend until broken or naturally expire.
WHY IT MATTERS: Traditional zone indicators often fall short in fast-changing conditions. This one adjusts automatically, helping you stay one step ahead.
EXAMPLE: On a 4H BTCUSD chart, a demand zone will form at a key support level and adjust its size depending on whether the market is quiet or volatile.
2. MARKET BIAS PIVOT LINE; This dynamic line helps you quickly see whether the market is trending up or down so you can trade in the direction of strength.
HOW IT WORKS:
Based on recent swing highs and lows (default: last 4 bars).
Line is green when price is above (bullish), red when below (bearish).
Updates live and can be turned on/off in settings.
WHY IT MATTERS: It’s a built-in trend filter. Use it to avoid fighting the market.
EXAMPLE: If SPY is above a green pivot and enters a demand zone, it’s a solid bullish setup.
3. DUAL ENTRY SIGNALS (S1 and S2) The strategy gives you two signal types depending on your risk style:
S1 SIGNALS: Early entry, based on basic confirmation (like a bullish engulfing pattern).
S2 SIGNALS: Stronger entry, requiring solid candle confirmation, volume spike, and close near the zone.
HOW IT WORKS:
S1 = good for aggressive traders or small size entries.
S2 = better for high-conviction trades and bigger position sizes.
Both signals follow your selected market mood (bullish or bearish).
WHY IT MATTERS: Flexibility! Most indicators only offer one signal style. This one gives you choice.
EXAMPLE: In EURUSD, S1 might show up when price taps a demand zone and forms a small bullish candle. If volume increases and the next candle closes strong, S2 confirms the entry.
4. VOLUME CONFIRMATION This filters out weak signals by checking for real buying/selling interest.
HOW IT WORKS:
Compares current volume to previous bar and a 10–14 bar average.
Adjustable volume thresholds for S1 and S2.
Can be disabled for markets with unreliable volume (like certain forex pairs).
WHY IT MATTERS: It adds a layer of quality control. High-volume moves usually mean higher conviction.
EXAMPLE: On AAPL, an S2 will only trigger if volume jumps by 1.3x the average, signaling strong seller presence.
5. BUILT-IN FIBONACCI TARGETS (TP1, TP2, SL) No more guessing exits. The strategy draws take profit (TP) and stop loss (SL) levels automatically based on zone size.
HOW IT WORKS:
TP1 = 2.12x the zone height
TP2 = 3.3x the zone height
SL = 1x the zone height (all adjustable)
These are shown as dashed (TP) and solid (SL) lines with labels
WHY IT MATTERS: Reduces emotional decision-making. Helps you plan trades with consistent risk/reward.
Example: In GOLD, if the demand zone is $20 tall, TP1 would be ~$42.40 higher, TP2 ~$66 higher, and SL $20 lower.
6. FULLY CUSTOMIZABLE INPUTS Tweak the settings to match your style and asset type.
KEY INPUTS:
Market Mood: Choose bullish (1) or bearish (2)
Timeframe Filter: Focus only on reliable zones (30M or 4H) or can disable to show on every timeframe
Zone Limit: Limit how many zones show (e.g., max 4)
Breakout Buffer: Defines how much price must move to break a zone
Zone Opacity: Make zones more/less visible
WHY IT MATTERS: This lets you dial in the indicator for scalping, swing trading, crypto, stocks, or forex.
Example: A scalper might use tighter zones and a low breakout buffer, while a swing trader prefers more zones and higher volatility mode.
7. DEBUG MODE (Optional) Get under the hood and see exactly how the strategy works.
HOW IT WORKS:
Shows metrics like ATR, volatility mode, memory usage, signal win rate, etc.
Plots visual lines showing zone age and success rate (TP1 hit tracking)
WHY IT MATTERS: Very few indicators show their math. This one does—great for power users who want to optimize.
EXAMPLE: You might discover that signals perform best in high volatility mode during news events, helping you adjust settings accordingly.
HOW TO USE IT
1. Add it to your TradingView chart (30M or 4H timeframes recommended).
2. Adjust inputs:
Market Mood = 1 (bullish) or 2 (bearish)
Pick your Volatility Mode
Set Zone Collector Limit (3–4 works well)
Use Timeframe Filter for better signals
3. Watch for S1 and S2:
S1 = quicker trades, lighter risk
S2 = stronger confirmation, bigger trades
4. Use the Pivot Line for trade direction.
5. Manage exits with auto TP/SL levels.
6. Turn on Debug Mode if you want detailed stats.
WORKS VERY WELL WITHOUT REPAINTING
Why It’s a Game-Changer; IT takes the guesswork out of zone trading. It’s not just smart—it’s adaptive. From volatility and volume to dynamic signals and exit plans, everything adjusts based on what the market is doing. And with a built-in trend filter and real-time debug info, it’s like having a trading co-pilot that’s always alert.
Why It’s Different Most zone indicators are basic. This one isn’t. Here’s why:
Adaptive zones that change with the market
Dual signal system (S1/S2) for flexibility
Volume confirmation to filter noise
Built-in Fibonacci targets for clean exits
Debug mode that shows you how it works
YOU CAN SET ALERTS WITHOUT repainting
THIS isn’t just another tool—it’s a smarter, more responsive way to trade.

YZH super wma modelYZH Super WMA Model
Overview
The "YZH Super WMA Model" is a customizable technical analysis indicator built in Pine Script v5 for TradingView. It generates trading signals using three configurable moving averages (MA1, MA2, MA3) and a wick-based filter to enhance signal accuracy. The indicator is overlaid on the price chart and supports multiple MA types: SMA, EMA, WMA, HMA, RMA, and VWMA.
Features
Flexible Moving Averages:
Three MAs (MA1, MA2, MA3) with customizable types and periods.
Default settings: MA1 (50-period SMA), MA2 (200-period HMA), MA3 (100-period EMA).
Adjustable visibility, colors, and line widths.
Wick-Based Filter:
Uses a wick ratio threshold (default: 0.5) to filter signals based on candle wick size.
Enhances signal reliability by focusing on significant wick patterns.
Signal and Trend Logic:
Signal MA (default: MA1) generates entry signals; trend MA (default: MA2) filters trend direction.
Long signals: Price crosses above signal MA, closes above trend MA, with sufficient lower wick.
Short signals: Price crosses below signal MA, closes below trend MA, with sufficient upper wick.
Signals confirmed within a user-defined bar range (default: 5).
Visualization:
Long signals: Green upward triangles below bars, labeled "L".
Short signals: Red downward triangles above bars, labeled "S".
Optional setup points and information table for enhanced analysis.
Alerts:
Triggers alerts on confirmed signals with detailed messages including signal type, MA settings, and price.
Recommended Settings
SMA20-SMA200: For swing trading, capturing short-term vs. long-term trends.
SMA50-HMA200: For trend-following, balancing medium-term signals with smooth long-term trends.
WMA48-WMA200: For volatile markets, emphasizing recent price action.
WMA174-SMA200: For higher time frame (HTF) trend following, ideal for long-term analysis.
Use Cases
Trend following, reversal trading, and customizable strategies.
Suitable for various markets (stocks, forex, crypto) and timeframes.
How to Use
Add to TradingView chart.
Configure MA types, periods, and colors.
Adjust wick threshold and trigger bars.
Enable visualizations and alerts as needed.
Conclusion
The "YZH Super WMA Model" is a robust tool for traders seeking reliable, customizable signals. Backtest the recommended settings to optimize for your market and timeframe.

TIME-SPLT ACADEMY INDICATOR# TIME-SPLT ACADEMY CISD + FVG + TSM FRACTALS - Comprehensive Market Structure Analysis Tool
## Overview
This indicator combines three essential market structure analysis components into a unified trading tool: Change in State Direction (CISD), Fair Value Gaps (FVG), and TSM Fractals. This integration provides traders with a complete framework for identifying market structure breaks, price imbalances, and key pivot levels on any timeframe.
## Component 1: CISD (Change in State Direction)
**What it is:** CISD identifies significant breaks in market structure by tracking when price decisively breaks above previous swing highs (bullish CISD) or below previous swing lows (bearish CISD). This concept is fundamental to understanding trend changes and continuation patterns.
**How it works:**
- Monitors swing highs and lows using customizable pivot periods
- Tracks when price closes above a previous swing high (bullish structure break)
- Tracks when price closes below a previous swing low (bearish structure break)
- Draws horizontal lines from the pivot point to the break point with "CISD" labels
- Works on multiple timeframes simultaneously
**Trading Applications:**
- Identifies trend changes and continuation signals
- Provides entry signals on structure breaks
- Helps determine market bias and direction
## Component 2: FVG (Fair Value Gaps)
**What it is:** Fair Value Gaps are price imbalances that occur when there's a gap between the high of one candle and the low of another candle two periods later, with the middle candle not filling this gap. These represent areas where price moved inefficiently and often return to "fill" the gap.
**How it works:**
- Analyzes 3-candle patterns to identify gaps
- Bearish FVG: Gap between low and high where price dropped leaving unfilled space above
- Bullish FVG: Gap between high and low where price rose leaving unfilled space below
- Tracks 8 different candle body combinations for each direction (up, down, doji patterns)
- Monitors gap mitigation when price returns to fill the imbalance
- Changes color when gaps are partially or fully mitigated
**Gap Detection Logic:**
- Bearish FVG patterns: DDD, DDJ, JDD, UDJ, JDU, UDD, DDU, UDU
- Bullish FVG patterns: DUD, DUJ, JUD, UUJ, JUU, UUD, DUU, UUU
- (D=Down candle, U=Up candle, J=Doji candle)
**Trading Applications:**
- High-probability reversal zones when price returns to FVGs
- Support and resistance levels
- Target areas for limit orders
- Risk management reference points
## Component 3: TSM Fractals
**What it is:** TSM Fractals identify significant pivot highs and lows using Williams Fractal methodology. These mark potential reversal points and key support/resistance levels.
**How it works:**
- Identifies fractal highs: peaks where the center candle's high is higher than surrounding candles
- Identifies fractal lows: valleys where the center candle's low is lower than surrounding candles
- Uses customizable lookback periods (default 15) for fractal identification
- Displays horizontal lines with "$" symbols at fractal levels
- Maintains a configurable number of recent fractals on the chart
**Trading Applications:**
- Key support and resistance levels
- Potential reversal zones
- Confluence with other analysis tools
- Stop loss placement reference points
## Why This Combination Works
**Synergistic Analysis:** Each component provides different but complementary information:
1. **CISD** shows when market structure changes, indicating trend shifts or continuation
2. **FVGs** reveal where price has moved inefficiently and may return for rebalancing
3. **Fractals** highlight key pivot points that often act as support/resistance
**Trading Edge:** The combination allows for:
- **Entry Confirmation:** Wait for CISD breaks near unfilled FVGs at fractal levels
- **Risk Management:** Use FVG boundaries and fractal levels for stop placement
- **Target Selection:** Project moves to opposite FVGs or fractal levels
- **Market Context:** Understand whether you're trading with or against structure
## Key Features
**Multi-Timeframe CISD:**
- Customizable timeframe settings (Minute, Hour, Day, Week, Month)
- Adjustable swing length for pivot identification
- Customizable line styles, widths, and colors
- Optional alerts on structure breaks
**Advanced FVG Management:**
- Automatic gap size filtering
- Real-time mitigation tracking
- Color-coded active vs. mitigated gaps
- Optional pip value labels
- Large gap alerts for significant imbalances
**Intelligent Fractal Display:**
- Configurable fractal periods
- Maximum fractal count management
- Clean visual presentation
- Historical fractal preservation
## Settings & Customization
**CISD Settings:**
- Timeframe selection and multipliers
- Swing length adjustment (default 7)
- Line styling options
- Color customization for bullish/bearish breaks
- Alert toggle options
**FVG Settings:**
- Show/hide toggles for each direction
- Minimum gap size filtering
- Alert threshold for large gaps
- Color schemes for active and mitigated gaps
- Optional size labels in pips
**Fractal Settings:**
- Fractal period adjustment (default 15)
- Maximum display count (default 10)
- Show/hide toggle
## Educational Value
This indicator teaches traders to:
- Understand market structure concepts
- Recognize price inefficiencies
- Identify key pivot points
- Combine multiple analysis methods
- Develop systematic trading approaches
## Use Cases
**Swing Trading:** Identify major structure breaks with FVG confluence
**Day Trading:** Use lower timeframe CISDs with intraday FVGs
**Scalping:** Quick entries at FVG mitigation near fractal levels
**Position Trading:** Higher timeframe structure analysis with major FVGs
## Technical Implementation
- Utilizes Pine Script v6 for optimal performance
- Efficient array management for historical data
- Real-time calculations without repainting
- Memory-optimized box and line management
- Multi-timeframe data handling with proper security functions
This comprehensive tool eliminates the need for multiple separate indicators, providing everything needed for complete market structure analysis in one cohesive package. The educational component helps traders understand not just what the signals are, but why they work and how to use them effectively in different market conditions.

Tensor Market Analysis Engine (TMAE)# Tensor Market Analysis Engine (TMAE)
## Advanced Multi-Dimensional Mathematical Analysis System
*Where Quantum Mathematics Meets Market Structure*
---
## 🎓 THEORETICAL FOUNDATION
The Tensor Market Analysis Engine represents a revolutionary synthesis of three cutting-edge mathematical frameworks that have never before been combined for comprehensive market analysis. This indicator transcends traditional technical analysis by implementing advanced mathematical concepts from quantum mechanics, information theory, and fractal geometry.
### 🌊 Multi-Dimensional Volatility with Jump Detection
**Hawkes Process Implementation:**
The TMAE employs a sophisticated Hawkes process approximation for detecting self-exciting market jumps. Unlike traditional volatility measures that treat price movements as independent events, the Hawkes process recognizes that market shocks cluster and exhibit memory effects.
**Mathematical Foundation:**
```
Intensity λ(t) = μ + Σ α(t - Tᵢ)
```
Where market jumps at times Tᵢ increase the probability of future jumps through the decay function α, controlled by the Hawkes Decay parameter (0.5-0.99).
**Mahalanobis Distance Calculation:**
The engine calculates volatility jumps using multi-dimensional Mahalanobis distance across up to 5 volatility dimensions:
- **Dimension 1:** Price volatility (standard deviation of returns)
- **Dimension 2:** Volume volatility (normalized volume fluctuations)
- **Dimension 3:** Range volatility (high-low spread variations)
- **Dimension 4:** Correlation volatility (price-volume relationship changes)
- **Dimension 5:** Microstructure volatility (intrabar positioning analysis)
This creates a volatility state vector that captures market behavior impossible to detect with traditional single-dimensional approaches.
### 📐 Hurst Exponent Regime Detection
**Fractal Market Hypothesis Integration:**
The TMAE implements advanced Rescaled Range (R/S) analysis to calculate the Hurst exponent in real-time, providing dynamic regime classification:
- **H > 0.6:** Trending (persistent) markets - momentum strategies optimal
- **H < 0.4:** Mean-reverting (anti-persistent) markets - contrarian strategies optimal
- **H ≈ 0.5:** Random walk markets - breakout strategies preferred
**Adaptive R/S Analysis:**
Unlike static implementations, the TMAE uses adaptive windowing that adjusts to market conditions:
```
H = log(R/S) / log(n)
```
Where R is the range of cumulative deviations and S is the standard deviation over period n.
**Dynamic Regime Classification:**
The system employs hysteresis to prevent regime flipping, requiring sustained Hurst values before regime changes are confirmed. This prevents false signals during transitional periods.
### 🔄 Transfer Entropy Analysis
**Information Flow Quantification:**
Transfer entropy measures the directional flow of information between price and volume, revealing lead-lag relationships that indicate future price movements:
```
TE(X→Y) = Σ p(yₜ₊₁, yₜ, xₜ) log
```
**Causality Detection:**
- **Volume → Price:** Indicates accumulation/distribution phases
- **Price → Volume:** Suggests retail participation or momentum chasing
- **Balanced Flow:** Market equilibrium or transition periods
The system analyzes multiple lag periods (2-20 bars) to capture both immediate and structural information flows.
---
## 🔧 COMPREHENSIVE INPUT SYSTEM
### Core Parameters Group
**Primary Analysis Window (10-100, Default: 50)**
The fundamental lookback period affecting all calculations. Optimization by timeframe:
- **1-5 minute charts:** 20-30 (rapid adaptation to micro-movements)
- **15 minute-1 hour:** 30-50 (balanced responsiveness and stability)
- **4 hour-daily:** 50-100 (smooth signals, reduced noise)
- **Asset-specific:** Cryptocurrency 20-35, Stocks 35-50, Forex 40-60
**Signal Sensitivity (0.1-2.0, Default: 0.7)**
Master control affecting all threshold calculations:
- **Conservative (0.3-0.6):** High-quality signals only, fewer false positives
- **Balanced (0.7-1.0):** Optimal risk-reward ratio for most trading styles
- **Aggressive (1.1-2.0):** Maximum signal frequency, requires careful filtering
**Signal Generation Mode:**
- **Aggressive:** Any component signals (highest frequency)
- **Confluence:** 2+ components agree (balanced approach)
- **Conservative:** All 3 components align (highest quality)
### Volatility Jump Detection Group
**Volatility Dimensions (2-5, Default: 3)**
Determines the mathematical space complexity:
- **2D:** Price + Volume volatility (suitable for clean markets)
- **3D:** + Range volatility (optimal for most conditions)
- **4D:** + Correlation volatility (advanced multi-asset analysis)
- **5D:** + Microstructure volatility (maximum sensitivity)
**Jump Detection Threshold (1.5-4.0σ, Default: 3.0σ)**
Standard deviations required for volatility jump classification:
- **Cryptocurrency:** 2.0-2.5σ (naturally volatile)
- **Stock Indices:** 2.5-3.0σ (moderate volatility)
- **Forex Major Pairs:** 3.0-3.5σ (typically stable)
- **Commodities:** 2.0-3.0σ (varies by commodity)
**Jump Clustering Decay (0.5-0.99, Default: 0.85)**
Hawkes process memory parameter:
- **0.5-0.7:** Fast decay (jumps treated as independent)
- **0.8-0.9:** Moderate clustering (realistic market behavior)
- **0.95-0.99:** Strong clustering (crisis/event-driven markets)
### Hurst Exponent Analysis Group
**Calculation Method Options:**
- **Classic R/S:** Original Rescaled Range (fast, simple)
- **Adaptive R/S:** Dynamic windowing (recommended for trading)
- **DFA:** Detrended Fluctuation Analysis (best for noisy data)
**Trending Threshold (0.55-0.8, Default: 0.60)**
Hurst value defining persistent market behavior:
- **0.55-0.60:** Weak trend persistence
- **0.65-0.70:** Clear trending behavior
- **0.75-0.80:** Strong momentum regimes
**Mean Reversion Threshold (0.2-0.45, Default: 0.40)**
Hurst value defining anti-persistent behavior:
- **0.35-0.45:** Weak mean reversion
- **0.25-0.35:** Clear ranging behavior
- **0.15-0.25:** Strong reversion tendency
### Transfer Entropy Parameters Group
**Information Flow Analysis:**
- **Price-Volume:** Classic flow analysis for accumulation/distribution
- **Price-Volatility:** Risk flow analysis for sentiment shifts
- **Multi-Timeframe:** Cross-timeframe causality detection
**Maximum Lag (2-20, Default: 5)**
Causality detection window:
- **2-5 bars:** Immediate causality (scalping)
- **5-10 bars:** Short-term flow (day trading)
- **10-20 bars:** Structural flow (swing trading)
**Significance Threshold (0.05-0.3, Default: 0.15)**
Minimum entropy for signal generation:
- **0.05-0.10:** Detect subtle information flows
- **0.10-0.20:** Clear causality only
- **0.20-0.30:** Very strong flows only
---
## 🎨 ADVANCED VISUAL SYSTEM
### Tensor Volatility Field Visualization
**Five-Layer Resonance Bands:**
The tensor field creates dynamic support/resistance zones that expand and contract based on mathematical field strength:
- **Core Layer (Purple):** Primary tensor field with highest intensity
- **Layer 2 (Neutral):** Secondary mathematical resonance
- **Layer 3 (Info Blue):** Tertiary harmonic frequencies
- **Layer 4 (Warning Gold):** Outer field boundaries
- **Layer 5 (Success Green):** Maximum field extension
**Field Strength Calculation:**
```
Field Strength = min(3.0, Mahalanobis Distance × Tensor Intensity)
```
The field amplitude adjusts to ATR and mathematical distance, creating dynamic zones that respond to market volatility.
**Radiation Line Network:**
During active tensor states, the system projects directional radiation lines showing field energy distribution:
- **8 Directional Rays:** Complete angular coverage
- **Tapering Segments:** Progressive transparency for natural visual flow
- **Pulse Effects:** Enhanced visualization during volatility jumps
### Dimensional Portal System
**Portal Mathematics:**
Dimensional portals visualize regime transitions using category theory principles:
- **Green Portals (◉):** Trending regime detection (appear below price for support)
- **Red Portals (◎):** Mean-reverting regime (appear above price for resistance)
- **Yellow Portals (○):** Random walk regime (neutral positioning)
**Tensor Trail Effects:**
Each portal generates 8 trailing particles showing mathematical momentum:
- **Large Particles (●):** Strong mathematical signal
- **Medium Particles (◦):** Moderate signal strength
- **Small Particles (·):** Weak signal continuation
- **Micro Particles (˙):** Signal dissipation
### Information Flow Streams
**Particle Stream Visualization:**
Transfer entropy creates flowing particle streams indicating information direction:
- **Upward Streams:** Volume leading price (accumulation phases)
- **Downward Streams:** Price leading volume (distribution phases)
- **Stream Density:** Proportional to information flow strength
**15-Particle Evolution:**
Each stream contains 15 particles with progressive sizing and transparency, creating natural flow visualization that makes information transfer immediately apparent.
### Fractal Matrix Grid System
**Multi-Timeframe Fractal Levels:**
The system calculates and displays fractal highs/lows across five Fibonacci periods:
- **8-Period:** Short-term fractal structure
- **13-Period:** Intermediate-term patterns
- **21-Period:** Primary swing levels
- **34-Period:** Major structural levels
- **55-Period:** Long-term fractal boundaries
**Triple-Layer Visualization:**
Each fractal level uses three-layer rendering:
- **Shadow Layer:** Widest, darkest foundation (width 5)
- **Glow Layer:** Medium white core line (width 3)
- **Tensor Layer:** Dotted mathematical overlay (width 1)
**Intelligent Labeling System:**
Smart spacing prevents label overlap using ATR-based minimum distances. Labels include:
- **Fractal Period:** Time-based identification
- **Topological Class:** Mathematical complexity rating (0, I, II, III)
- **Price Level:** Exact fractal price
- **Mahalanobis Distance:** Current mathematical field strength
- **Hurst Exponent:** Current regime classification
- **Anomaly Indicators:** Visual strength representations (○ ◐ ● ⚡)
### Wick Pressure Analysis
**Rejection Level Mathematics:**
The system analyzes candle wick patterns to project future pressure zones:
- **Upper Wick Analysis:** Identifies selling pressure and resistance zones
- **Lower Wick Analysis:** Identifies buying pressure and support zones
- **Pressure Projection:** Extends lines forward based on mathematical probability
**Multi-Layer Glow Effects:**
Wick pressure lines use progressive transparency (1-8 layers) creating natural glow effects that make pressure zones immediately visible without cluttering the chart.
### Enhanced Regime Background
**Dynamic Intensity Mapping:**
Background colors reflect mathematical regime strength:
- **Deep Transparency (98% alpha):** Subtle regime indication
- **Pulse Intensity:** Based on regime strength calculation
- **Color Coding:** Green (trending), Red (mean-reverting), Neutral (random)
**Smoothing Integration:**
Regime changes incorporate 10-bar smoothing to prevent background flicker while maintaining responsiveness to genuine regime shifts.
### Color Scheme System
**Six Professional Themes:**
- **Dark (Default):** Professional trading environment optimization
- **Light:** High ambient light conditions
- **Classic:** Traditional technical analysis appearance
- **Neon:** High-contrast visibility for active trading
- **Neutral:** Minimal distraction focus
- **Bright:** Maximum visibility for complex setups
Each theme maintains mathematical accuracy while optimizing visual clarity for different trading environments and personal preferences.
---
## 📊 INSTITUTIONAL-GRADE DASHBOARD
### Tensor Field Status Section
**Field Strength Display:**
Real-time Mahalanobis distance calculation with dynamic emoji indicators:
- **⚡ (Lightning):** Extreme field strength (>1.5× threshold)
- **● (Solid Circle):** Strong field activity (>1.0× threshold)
- **○ (Open Circle):** Normal field state
**Signal Quality Rating:**
Democratic algorithm assessment:
- **ELITE:** All 3 components aligned (highest probability)
- **STRONG:** 2 components aligned (good probability)
- **GOOD:** 1 component active (moderate probability)
- **WEAK:** No clear component signals
**Threshold and Anomaly Monitoring:**
- **Threshold Display:** Current mathematical threshold setting
- **Anomaly Level (0-100%):** Combined volatility and volume spike measurement
- **>70%:** High anomaly (red warning)
- **30-70%:** Moderate anomaly (orange caution)
- **<30%:** Normal conditions (green confirmation)
### Tensor State Analysis Section
**Mathematical State Classification:**
- **↑ BULL (Tensor State +1):** Trending regime with bullish bias
- **↓ BEAR (Tensor State -1):** Mean-reverting regime with bearish bias
- **◈ SUPER (Tensor State 0):** Random walk regime (neutral)
**Visual State Gauge:**
Five-circle progression showing tensor field polarity:
- **🟢🟢🟢⚪⚪:** Strong bullish mathematical alignment
- **⚪⚪🟡⚪⚪:** Neutral/transitional state
- **⚪⚪🔴🔴🔴:** Strong bearish mathematical alignment
**Trend Direction and Phase Analysis:**
- **📈 BULL / 📉 BEAR / ➡️ NEUTRAL:** Primary trend classification
- **🌪️ CHAOS:** Extreme information flow (>2.0 flow strength)
- **⚡ ACTIVE:** Strong information flow (1.0-2.0 flow strength)
- **😴 CALM:** Low information flow (<1.0 flow strength)
### Trading Signals Section
**Real-Time Signal Status:**
- **🟢 ACTIVE / ⚪ INACTIVE:** Long signal availability
- **🔴 ACTIVE / ⚪ INACTIVE:** Short signal availability
- **Components (X/3):** Active algorithmic components
- **Mode Display:** Current signal generation mode
**Signal Strength Visualization:**
Color-coded component count:
- **Green:** 3/3 components (maximum confidence)
- **Aqua:** 2/3 components (good confidence)
- **Orange:** 1/3 components (moderate confidence)
- **Gray:** 0/3 components (no signals)
### Performance Metrics Section
**Win Rate Monitoring:**
Estimated win rates based on signal quality with emoji indicators:
- **🔥 (Fire):** ≥60% estimated win rate
- **👍 (Thumbs Up):** 45-59% estimated win rate
- **⚠️ (Warning):** <45% estimated win rate
**Mathematical Metrics:**
- **Hurst Exponent:** Real-time fractal dimension (0.000-1.000)
- **Information Flow:** Volume/price leading indicators
- **📊 VOL:** Volume leading price (accumulation/distribution)
- **💰 PRICE:** Price leading volume (momentum/speculation)
- **➖ NONE:** Balanced information flow
- **Volatility Classification:**
- **🔥 HIGH:** Above 1.5× jump threshold
- **📊 NORM:** Normal volatility range
- **😴 LOW:** Below 0.5× jump threshold
### Market Structure Section (Large Dashboard)
**Regime Classification:**
- **📈 TREND:** Hurst >0.6, momentum strategies optimal
- **🔄 REVERT:** Hurst <0.4, contrarian strategies optimal
- **🎲 RANDOM:** Hurst ≈0.5, breakout strategies preferred
**Mathematical Field Analysis:**
- **Dimensions:** Current volatility space complexity (2D-5D)
- **Hawkes λ (Lambda):** Self-exciting jump intensity (0.00-1.00)
- **Jump Status:** 🚨 JUMP (active) / ✅ NORM (normal)
### Settings Summary Section (Large Dashboard)
**Active Configuration Display:**
- **Sensitivity:** Current master sensitivity setting
- **Lookback:** Primary analysis window
- **Theme:** Active color scheme
- **Method:** Hurst calculation method (Classic R/S, Adaptive R/S, DFA)
**Dashboard Sizing Options:**
- **Small:** Essential metrics only (mobile/small screens)
- **Normal:** Balanced information density (standard desktop)
- **Large:** Maximum detail (multi-monitor setups)
**Position Options:**
- **Top Right:** Standard placement (avoids price action)
- **Top Left:** Wide chart optimization
- **Bottom Right:** Recent price focus (scalping)
- **Bottom Left:** Maximum price visibility (swing trading)
---
## 🎯 SIGNAL GENERATION LOGIC
### Multi-Component Convergence System
**Component Signal Architecture:**
The TMAE generates signals through sophisticated component analysis rather than simple threshold crossing:
**Volatility Component:**
- **Jump Detection:** Mahalanobis distance threshold breach
- **Hawkes Intensity:** Self-exciting process activation (>0.2)
- **Multi-dimensional:** Considers all volatility dimensions simultaneously
**Hurst Regime Component:**
- **Trending Markets:** Price above SMA-20 with positive momentum
- **Mean-Reverting Markets:** Price at Bollinger Band extremes
- **Random Markets:** Bollinger squeeze breakouts with directional confirmation
**Transfer Entropy Component:**
- **Volume Leadership:** Information flow from volume to price
- **Volume Spike:** Volume 110%+ above 20-period average
- **Flow Significance:** Above entropy threshold with directional bias
### Democratic Signal Weighting
**Signal Mode Implementation:**
- **Aggressive Mode:** Any single component triggers signal
- **Confluence Mode:** Minimum 2 components must agree
- **Conservative Mode:** All 3 components must align
**Momentum Confirmation:**
All signals require momentum confirmation:
- **Long Signals:** RSI >50 AND price >EMA-9
- **Short Signals:** RSI <50 AND price 0.6):**
- **Increase Sensitivity:** Catch momentum continuation
- **Lower Mean Reversion Threshold:** Avoid counter-trend signals
- **Emphasize Volume Leadership:** Institutional accumulation/distribution
- **Tensor Field Focus:** Use expansion for trend continuation
- **Signal Mode:** Aggressive or Confluence for trend following
**Range-Bound Markets (Hurst <0.4):**
- **Decrease Sensitivity:** Avoid false breakouts
- **Lower Trending Threshold:** Quick regime recognition
- **Focus on Price Leadership:** Retail sentiment extremes
- **Fractal Grid Emphasis:** Support/resistance trading
- **Signal Mode:** Conservative for high-probability reversals
**Volatile Markets (High Jump Frequency):**
- **Increase Hawkes Decay:** Recognize event clustering
- **Higher Jump Threshold:** Avoid noise signals
- **Maximum Dimensions:** Capture full volatility complexity
- **Reduce Position Sizing:** Risk management adaptation
- **Enhanced Visuals:** Maximum information for rapid decisions
**Low Volatility Markets (Low Jump Frequency):**
- **Decrease Jump Threshold:** Capture subtle movements
- **Lower Hawkes Decay:** Treat moves as independent
- **Reduce Dimensions:** Simplify analysis
- **Increase Position Sizing:** Capitalize on compressed volatility
- **Minimal Visuals:** Reduce distraction in quiet markets
---
## 🚀 ADVANCED TRADING STRATEGIES
### The Mathematical Convergence Method
**Entry Protocol:**
1. **Fractal Grid Approach:** Monitor price approaching significant fractal levels
2. **Tensor Field Confirmation:** Verify field expansion supporting direction
3. **Portal Signal:** Wait for dimensional portal appearance
4. **ELITE/STRONG Quality:** Only trade highest quality mathematical signals
5. **Component Consensus:** Confirm 2+ components agree in Confluence mode
**Example Implementation:**
- Price approaching 21-period fractal high
- Tensor field expanding upward (bullish mathematical alignment)
- Green portal appears below price (trending regime confirmation)
- ELITE quality signal with 3/3 components active
- Enter long position with stop below fractal level
**Risk Management:**
- **Stop Placement:** Below/above fractal level that generated signal
- **Position Sizing:** Based on Mahalanobis distance (higher distance = smaller size)
- **Profit Targets:** Next fractal level or tensor field resistance
### The Regime Transition Strategy
**Regime Change Detection:**
1. **Monitor Hurst Exponent:** Watch for persistent moves above/below thresholds
2. **Portal Color Change:** Regime transitions show different portal colors
3. **Background Intensity:** Increasing regime background intensity
4. **Mathematical Confirmation:** Wait for regime confirmation (hysteresis)
**Trading Implementation:**
- **Trending Transitions:** Trade momentum breakouts, follow trend
- **Mean Reversion Transitions:** Trade range boundaries, fade extremes
- **Random Transitions:** Trade breakouts with tight stops
**Advanced Techniques:**
- **Multi-Timeframe:** Confirm regime on higher timeframe
- **Early Entry:** Enter on regime transition rather than confirmation
- **Regime Strength:** Larger positions during strong regime signals
### The Information Flow Momentum Strategy
**Flow Detection Protocol:**
1. **Monitor Transfer Entropy:** Watch for significant information flow shifts
2. **Volume Leadership:** Strong edge when volume leads price
3. **Flow Acceleration:** Increasing flow strength indicates momentum
4. **Directional Confirmation:** Ensure flow aligns with intended trade direction
**Entry Signals:**
- **Volume → Price Flow:** Enter during accumulation/distribution phases
- **Price → Volume Flow:** Enter on momentum confirmation breaks
- **Flow Reversal:** Counter-trend entries when flow reverses
**Optimization:**
- **Scalping:** Use immediate flow detection (2-5 bar lag)
- **Swing Trading:** Use structural flow (10-20 bar lag)
- **Multi-Asset:** Compare flow between correlated assets
### The Tensor Field Expansion Strategy
**Field Mathematics:**
The tensor field expansion indicates mathematical pressure building in market structure:
**Expansion Phases:**
1. **Compression:** Field contracts, volatility decreases
2. **Tension Building:** Mathematical pressure accumulates
3. **Expansion:** Field expands rapidly with directional movement
4. **Resolution:** Field stabilizes at new equilibrium
**Trading Applications:**
- **Compression Trading:** Prepare for breakout during field contraction
- **Expansion Following:** Trade direction of field expansion
- **Reversion Trading:** Fade extreme field expansion
- **Multi-Dimensional:** Consider all field layers for confirmation
### The Hawkes Process Event Strategy
**Self-Exciting Jump Trading:**
Understanding that market shocks cluster and create follow-on opportunities:
**Jump Sequence Analysis:**
1. **Initial Jump:** First volatility jump detected
2. **Clustering Phase:** Hawkes intensity remains elevated
3. **Follow-On Opportunities:** Additional jumps more likely
4. **Decay Period:** Intensity gradually decreases
**Implementation:**
- **Jump Confirmation:** Wait for mathematical jump confirmation
- **Direction Assessment:** Use other components for direction
- **Clustering Trades:** Trade subsequent moves during high intensity
- **Decay Exit:** Exit positions as Hawkes intensity decays
### The Fractal Confluence System
**Multi-Timeframe Fractal Analysis:**
Combining fractal levels across different periods for high-probability zones:
**Confluence Zones:**
- **Double Confluence:** 2 fractal levels align
- **Triple Confluence:** 3+ fractal levels cluster
- **Mathematical Confirmation:** Tensor field supports the level
- **Information Flow:** Transfer entropy confirms direction
**Trading Protocol:**
1. **Identify Confluence:** Find 2+ fractal levels within 1 ATR
2. **Mathematical Support:** Verify tensor field alignment
3. **Signal Quality:** Wait for STRONG or ELITE signal
4. **Risk Definition:** Use fractal level for stop placement
5. **Profit Targeting:** Next major fractal confluence zone
---
## ⚠️ COMPREHENSIVE RISK MANAGEMENT
### Mathematical Position Sizing
**Mahalanobis Distance Integration:**
Position size should inversely correlate with mathematical field strength:
```
Position Size = Base Size × (Threshold / Mahalanobis Distance)
```
**Risk Scaling Matrix:**
- **Low Field Strength (<2.0):** Standard position sizing
- **Moderate Field Strength (2.0-3.0):** 75% position sizing
- **High Field Strength (3.0-4.0):** 50% position sizing
- **Extreme Field Strength (>4.0):** 25% position sizing or no trade
### Signal Quality Risk Adjustment
**Quality-Based Position Sizing:**
- **ELITE Signals:** 100% of planned position size
- **STRONG Signals:** 75% of planned position size
- **GOOD Signals:** 50% of planned position size
- **WEAK Signals:** No position or paper trading only
**Component Agreement Scaling:**
- **3/3 Components:** Full position size
- **2/3 Components:** 75% position size
- **1/3 Components:** 50% position size or skip trade
### Regime-Adaptive Risk Management
**Trending Market Risk:**
- **Wider Stops:** Allow for trend continuation
- **Trend Following:** Trade with regime direction
- **Higher Position Size:** Trend probability advantage
- **Momentum Stops:** Trail stops based on momentum indicators
**Mean-Reverting Market Risk:**
- **Tighter Stops:** Quick exits on trend continuation
- **Contrarian Positioning:** Trade against extremes
- **Smaller Position Size:** Higher reversal failure rate
- **Level-Based Stops:** Use fractal levels for stops
**Random Market Risk:**
- **Breakout Focus:** Trade only clear breakouts
- **Tight Initial Stops:** Quick exit if breakout fails
- **Reduced Frequency:** Skip marginal setups
- **Range-Based Targets:** Profit targets at range boundaries
### Volatility-Adaptive Risk Controls
**High Volatility Periods:**
- **Reduced Position Size:** Account for wider price swings
- **Wider Stops:** Avoid noise-based exits
- **Lower Frequency:** Skip marginal setups
- **Faster Exits:** Take profits more quickly
**Low Volatility Periods:**
- **Standard Position Size:** Normal risk parameters
- **Tighter Stops:** Take advantage of compressed ranges
- **Higher Frequency:** Trade more setups
- **Extended Targets:** Allow for compressed volatility expansion
### Multi-Timeframe Risk Alignment
**Higher Timeframe Trend:**
- **With Trend:** Standard or increased position size
- **Against Trend:** Reduced position size or skip
- **Neutral Trend:** Standard position size with tight management
**Risk Hierarchy:**
1. **Primary:** Current timeframe signal quality
2. **Secondary:** Higher timeframe trend alignment
3. **Tertiary:** Mathematical field strength
4. **Quaternary:** Market regime classification
---
## 📚 EDUCATIONAL VALUE AND MATHEMATICAL CONCEPTS
### Advanced Mathematical Concepts
**Tensor Analysis in Markets:**
The TMAE introduces traders to tensor analysis, a branch of mathematics typically reserved for physics and advanced engineering. Tensors provide a framework for understanding multi-dimensional market relationships that scalar and vector analysis cannot capture.
**Information Theory Applications:**
Transfer entropy implementation teaches traders about information flow in markets, a concept from information theory that quantifies directional causality between variables. This provides intuition about market microstructure and participant behavior.
**Fractal Geometry in Trading:**
The Hurst exponent calculation exposes traders to fractal geometry concepts, helping understand that markets exhibit self-similar patterns across multiple timeframes. This mathematical insight transforms how traders view market structure.
**Stochastic Process Theory:**
The Hawkes process implementation introduces concepts from stochastic process theory, specifically self-exciting point processes. This provides mathematical framework for understanding why market events cluster and exhibit memory effects.
### Learning Progressive Complexity
**Beginner Mathematical Concepts:**
- **Volatility Dimensions:** Understanding multi-dimensional analysis
- **Regime Classification:** Learning market personality types
- **Signal Democracy:** Algorithmic consensus building
- **Visual Mathematics:** Interpreting mathematical concepts visually
**Intermediate Mathematical Applications:**
- **Mahalanobis Distance:** Statistical distance in multi-dimensional space
- **Rescaled Range Analysis:** Fractal dimension measurement
- **Information Entropy:** Quantifying uncertainty and causality
- **Field Theory:** Understanding mathematical fields in market context
**Advanced Mathematical Integration:**
- **Tensor Field Dynamics:** Multi-dimensional market force analysis
- **Stochastic Self-Excitation:** Event clustering and memory effects
- **Categorical Composition:** Mathematical signal combination theory
- **Topological Market Analysis:** Understanding market shape and connectivity
### Practical Mathematical Intuition
**Developing Market Mathematics Intuition:**
The TMAE serves as a bridge between abstract mathematical concepts and practical trading applications. Traders develop intuitive understanding of:
- **How markets exhibit mathematical structure beneath apparent randomness**
- **Why multi-dimensional analysis reveals patterns invisible to single-variable approaches**
- **How information flows through markets in measurable, predictable ways**
- **Why mathematical models provide probabilistic edges rather than certainties**
---
## 🔬 IMPLEMENTATION AND OPTIMIZATION
### Getting Started Protocol
**Phase 1: Observation (Week 1)**
1. **Apply with defaults:** Use standard settings on your primary trading timeframe
2. **Study visual elements:** Learn to interpret tensor fields, portals, and streams
3. **Monitor dashboard:** Observe how metrics change with market conditions
4. **No trading:** Focus entirely on pattern recognition and understanding
**Phase 2: Pattern Recognition (Week 2-3)**
1. **Identify signal patterns:** Note what market conditions produce different signal qualities
2. **Regime correlation:** Observe how Hurst regimes affect signal performance
3. **Visual confirmation:** Learn to read tensor field expansion and portal signals
4. **Component analysis:** Understand which components drive signals in different markets
**Phase 3: Parameter Optimization (Week 4-5)**
1. **Asset-specific tuning:** Adjust parameters for your specific trading instrument
2. **Timeframe optimization:** Fine-tune for your preferred trading timeframe
3. **Sensitivity adjustment:** Balance signal frequency with quality
4. **Visual customization:** Optimize colors and intensity for your trading environment
**Phase 4: Live Implementation (Week 6+)**
1. **Paper trading:** Test signals with hypothetical trades
2. **Small position sizing:** Begin with minimal risk during learning phase
3. **Performance tracking:** Monitor actual vs. expected signal performance
4. **Continuous optimization:** Refine settings based on real performance data
### Performance Monitoring System
**Signal Quality Tracking:**
- **ELITE Signal Win Rate:** Track highest quality signals separately
- **Component Performance:** Monitor which components provide best signals
- **Regime Performance:** Analyze performance across different market regimes
- **Timeframe Analysis:** Compare performance across different session times
**Mathematical Metric Correlation:**
- **Field Strength vs. Performance:** Higher field strength should correlate with better performance
- **Component Agreement vs. Win Rate:** More component agreement should improve win rates
- **Regime Alignment vs. Success:** Trading with mathematical regime should outperform
### Continuous Optimization Process
**Monthly Review Protocol:**
1. **Performance Analysis:** Review win rates, profit factors, and maximum drawdown
2. **Parameter Assessment:** Evaluate if current settings remain optimal
3. **Market Adaptation:** Adjust for changes in market character or volatility
4. **Component Weighting:** Consider if certain components should receive more/less emphasis
**Quarterly Deep Analysis:**
1. **Mathematical Model Validation:** Verify that mathematical relationships remain valid
2. **Regime Distribution:** Analyze time spent in different market regimes
3. **Signal Evolution:** Track how signal characteristics change over time
4. **Correlation Analysis:** Monitor correlations between different mathematical components
---
## 🌟 UNIQUE INNOVATIONS AND CONTRIBUTIONS
### Revolutionary Mathematical Integration
**First-Ever Implementations:**
1. **Multi-Dimensional Volatility Tensor:** First indicator to implement true tensor analysis for market volatility
2. **Real-Time Hawkes Process:** First trading implementation of self-exciting point processes
3. **Transfer Entropy Trading Signals:** First practical application of information theory for trade generation
4. **Democratic Component Voting:** First algorithmic consensus system for signal generation
5. **Fractal-Projected Signal Quality:** First system to predict signal quality at future price levels
### Advanced Visualization Innovations
**Mathematical Visualization Breakthroughs:**
- **Tensor Field Radiation:** Visual representation of mathematical field energy
- **Dimensional Portal System:** Category theory visualization for regime transitions
- **Information Flow Streams:** Real-time visual display of market information transfer
- **Multi-Layer Fractal Grid:** Intelligent spacing and projection system
- **Regime Intensity Mapping:** Dynamic background showing mathematical regime strength
### Practical Trading Innovations
**Trading System Advances:**
- **Quality-Weighted Signal Generation:** Signals rated by mathematical confidence
- **Regime-Adaptive Strategy Selection:** Automatic strategy optimization based on market personality
- **Anti-Spam Signal Protection:** Mathematical prevention of signal clustering
- **Component Performance Tracking:** Real-time monitoring of algorithmic component success
- **Field-Strength Position Sizing:** Mathematical volatility integration for risk management
---
## ⚖️ RESPONSIBLE USAGE AND LIMITATIONS
### Mathematical Model Limitations
**Understanding Model Boundaries:**
While the TMAE implements sophisticated mathematical concepts, traders must understand fundamental limitations:
- **Markets Are Not Purely Mathematical:** Human psychology, news events, and fundamental factors create unpredictable elements
- **Past Performance Limitations:** Mathematical relationships that worked historically may not persist indefinitely
- **Model Risk:** Complex models can fail during unprecedented market conditions
- **Overfitting Potential:** Highly optimized parameters may not generalize to future market conditions
### Proper Implementation Guidelines
**Risk Management Requirements:**
- **Never Risk More Than 2% Per Trade:** Regardless of signal quality
- **Diversification Mandatory:** Don't rely solely on mathematical signals
- **Position Sizing Discipline:** Use mathematical field strength for sizing, not confidence
- **Stop Loss Non-Negotiable:** Every trade must have predefined risk parameters
**Realistic Expectations:**
- **Mathematical Edge, Not Certainty:** The indicator provides probabilistic advantages, not guaranteed outcomes
- **Learning Curve Required:** Complex mathematical concepts require time to master
- **Market Adaptation Necessary:** Parameters must evolve with changing market conditions
- **Continuous Education Important:** Understanding underlying mathematics improves application
### Ethical Trading Considerations
**Market Impact Awareness:**
- **Information Asymmetry:** Advanced mathematical analysis may provide advantages over other market participants
- **Position Size Responsibility:** Large positions based on mathematical signals can impact market structure
- **Sharing Knowledge:** Consider educational contributions to trading community
- **Fair Market Participation:** Use mathematical advantages responsibly within market framework
### Professional Development Path
**Skill Development Sequence:**
1. **Basic Mathematical Literacy:** Understand fundamental concepts before advanced application
2. **Risk Management Mastery:** Develop disciplined risk control before relying on complex signals
3. **Market Psychology Understanding:** Combine mathematical analysis with behavioral market insights
4. **Continuous Learning:** Stay updated on mathematical finance developments and market evolution
---
## 🔮 CONCLUSION
The Tensor Market Analysis Engine represents a quantum leap forward in technical analysis, successfully bridging the gap between advanced pure mathematics and practical trading applications. By integrating multi-dimensional volatility analysis, fractal market theory, and information flow dynamics, the TMAE reveals market structure invisible to conventional analysis while maintaining visual clarity and practical usability.
### Mathematical Innovation Legacy
This indicator establishes new paradigms in technical analysis:
- **Tensor analysis for market volatility understanding**
- **Stochastic self-excitation for event clustering prediction**
- **Information theory for causality-based trade generation**
- **Democratic algorithmic consensus for signal quality enhancement**
- **Mathematical field visualization for intuitive market understanding**
### Practical Trading Revolution
Beyond mathematical innovation, the TMAE transforms practical trading:
- **Quality-rated signals replace binary buy/sell decisions**
- **Regime-adaptive strategies automatically optimize for market personality**
- **Multi-dimensional risk management integrates mathematical volatility measures**
- **Visual mathematical concepts make complex analysis immediately interpretable**
- **Educational value creates lasting improvement in trading understanding**
### Future-Proof Design
The mathematical foundations ensure lasting relevance:
- **Universal mathematical principles transcend market evolution**
- **Multi-dimensional analysis adapts to new market structures**
- **Regime detection automatically adjusts to changing market personalities**
- **Component democracy allows for future algorithmic additions**
- **Mathematical visualization scales with increasing market complexity**
### Commitment to Excellence
The TMAE represents more than an indicator—it embodies a philosophy of bringing rigorous mathematical analysis to trading while maintaining practical utility and visual elegance. Every component, from the multi-dimensional tensor fields to the democratic signal generation, reflects a commitment to mathematical accuracy, trading practicality, and educational value.
### Trading with Mathematical Precision
In an era where markets grow increasingly complex and computational, the TMAE provides traders with mathematical tools previously available only to institutional quantitative research teams. Yet unlike academic mathematical models, the TMAE translates complex concepts into intuitive visual representations and practical trading signals.
By combining the mathematical rigor of tensor analysis, the statistical power of multi-dimensional volatility modeling, and the information-theoretic insights of transfer entropy, traders gain unprecedented insight into market structure and dynamics.
### Final Perspective
Markets, like nature, exhibit profound mathematical beauty beneath apparent chaos. The Tensor Market Analysis Engine serves as a mathematical lens that reveals this hidden order, transforming how traders perceive and interact with market structure.
Through mathematical precision, visual elegance, and practical utility, the TMAE empowers traders to see beyond the noise and trade with the confidence that comes from understanding the mathematical principles governing market behavior.
Trade with mathematical insight. Trade with the power of tensors. Trade with the TMAE.
*"In mathematics, you don't understand things. You just get used to them." - John von Neumann*
*With the TMAE, mathematical market understanding becomes not just possible, but intuitive.*
— Dskyz, Trade with insight. Trade with anticipation.

Scanner Candles v2.01The "Scanner Candle v.2.01" is an indicator classifies candles based on the body/range ratio: indecisive (small body, ≤50%), decisive (medium body), explosive (large body, ≥70%). It includes EMAs to identify trends and "Reset Candles" (RC), small-bodied candles near EMAs, signaling potential reversals or continuations. Useful for analyzing volatility, breakouts, reversals, and risk management.
Description of the indicator:
The "Scanner Candle v.2.01" indicator classifies candles into three categories based on the proportion of the candle's body to its range (high-low):
Indecisive: candles with a small body (≤ set threshold, default 50%), indicating low volatility or market uncertainty.
Decisive: candles with a medium body, reflecting a clear but not extreme price movement.
Explosive: candles with a large body (≥ set threshold, default 70%), signaling strong directional moves.
Additionally, the indicator includes:
Customizable exponential moving averages (EMAs) to identify trends and support/resistance levels.
Detection of "Reset Candles" (RC), specific candles (e.g., dojis, ) with a small bodies body near EMAs, useful for identifying potential reversal or continuation points.
Coloring and visualization:
Candles are colored by category (white for indecisive, orange for decisive, purple for explosive).
Reset Candles are marked with circles above/below the candle (green for bullish, red for bearish).
Potential uses:
Volatility analysis: Identifying uncertain (indecisive), directional (decisive), or impulsive (explosive) market phases.
Breakout trading: Explosive candles can signal entry opportunities on strong moves.
Reversal detection: Reset Candles near EMAs can indicate turning points or trend continuation.
Trend-following support: Integrated EMAs contextualize candles within the main trend.
Risk management: Indecisive candles suggest avoiding trades in low-directionality phases.
The indicator is customizable (thresholds, colors, thresholdsEMAs, ) and adaptable to various timeframes and strategies, from day trading to swing trading.
Reset Candles:
Reset Candles (RC) are specific candles signaling potential reversals or continuations, often near EMAs. They are defined by:
Small body: Body < 5% of the range of the last 10 candles, indicating low volatility (e.g., doji).
EMA proximity: The candle is near or crosses a defined EMA (e.g., 10, 60, or 223 periods).
Trend conditions: Follows a red candle, with the close of the previous previous candles above a specific EMA, suggesting a potential bullish resumption or stabilization.
Limited spike: The candle has minimal tails (spikes, ) below a set threshold (default 1%).
Minimum timeframe: Appears on timeframes ≥ set value (default 5 minutes) or daily charts.
Non-consecutive: Not preceded by other RCs in the last 3 candles.
Types:
Doji_fin: Green circle above, signaling a bullish bullish setup near longer EMAs.
Dojifin_2: Yellow Red circle below, signaling a bearish setup near shorter EMAs.
Trading uses:
Reversal: RCs near EMAs signal bounces or rejections, ideal for counter-trend trades.
Continuation: In trends, RCs indicate pauses before trend resumption, offering low-risk entries.
Support/resistance confirmation: EMA proximity strengthens the level's significance.
Risk management: Small bodies and EMA proximity allow tight stop-losses.
Limitations:
False signals: Common in volatile or sideways markets; use with additional confirmation.
Timeframe dependency: More reliable on higher timeframes (e.g., 1-hour or daily).
Customization needed: Thresholds (e.g., spike, timeframe) must be tailored to the market.
Conclusion:
Reset Candles highlight low-volatility moments near technical levels (EMAs) that may precede significant moves. They are ideal for precise entries with tight stops in reversal or continuation strategies but require clear market context and additional confirmation for optimal effectiveness.
#ema #candlepattern #scalping

Session Range ProjectionsSession Range Projections
Purpose & Concept:
Session Range Projections is a comprehensive trading tool that identifies and analyzes price ranges during user-defined time periods. The indicator visualizes high-probability reversal zones and profit targets by projecting Fibonacci levels from custom session ranges, making it ideal for traders who focus on time-based market structure analysis.
Key Features & Calculations:
1. Custom Time Range Analysis
- Define any time period for range calculation - from traditional sessions (Asian, London, NY) to custom periods like opening ranges, hourly ranges, or 4-hour blocks
- Automatically captures the highest and lowest prices within your specified timeframe
- Supports multiple timezone selections for global market analysis
- Flexible enough for intraday scalping ranges or longer-term swing trading setups
2. Premium & Discount Zones
- Automatically divides the range into premium (above 50%) and discount (below 50%) zones
- Visual differentiation helps identify institutional buying and selling areas
- Color-coded boxes clearly mark these critical price zones
3. Optimal Trade Entry (OTE) Zones
- Highlights the 79-89% retracement zone in premium territory
- Highlights the 11-21% retracement zone in discount territory
- These zones represent high-probability reversal areas based on institutional order flow concepts
4. Fibonacci Projections
- Projects 11 customizable Fibonacci extension levels from the range extremes
- Levels extend both above and below the range for symmetrical analysis
- Each level can be individually toggled and color-customized
- Default levels include common retracement ratios: -0.5, -1.0, -2.0, -2.33, -2.5, -3.0, -4.0, -4.5, -6.0, -7.0, -8.0
How to Use:
Set Your Time Range: Input your desired session start and end times (24-hour format)
Select Timezone: Choose the appropriate timezone for your trading session
Customize Display: Toggle various visual elements based on your preferences
Monitor Price Action: Watch for reactions at projected levels and OTE zones
Set Alerts: Configure sweep alerts for when price breaks above/below range extremes
Input Parameters Explained:
Time Range Settings
Range Start/End Hour & Minute: Define your analysis period
Time Zone: Ensure accurate session timing across different markets
Visual Settings
Range Box: Toggle the premium/discount zone visualization
Horizontal Lines: Customize high/low line appearance
Internal Range Levels: Show/hide equilibrium and OTE zones
Labels: Configure text display for key levels
Fibonacci Projections: Enable/disable extension levels
Display Settings
Historical Ranges: Show up to 10 previous session ranges
Alert Type: Choose between high sweep, low sweep, or both
Trading Applications:
Session-Based Trading: Analyze specific market sessions (Asian, London, New York, opening ranges, hourly ranges)
Reversal Trading: Identify high-probability reversal zones at OTE levels
Breakout/Reversal Trading: Monitor range breaks/reversals with built-in sweep alerts
Risk Management: Use Fibonacci projections as profit targets or rejection areas
Multi-Timeframe Analysis: Apply to any timeframe for various trading styles
Important Notes:
This indicator is for educational purposes only and should not be considered financial advice
Past performance does not guarantee future results
Always use proper risk management when trading
The indicator automatically manages historical data to maintain chart performance

Timeframe Resistance Evaluation And Detection - CoffeeKillerTREAD - Timeframe Resistance Evaluation And Detection Guide
🔔 Important Technical Limitation 🔔
**This indicator does NOT fetch true higher timeframe data.** Instead, it simulates higher timeframe levels by aggregating data from your current chart timeframe. This means:
- Results will vary depending on what chart timeframe you're viewing
- Levels may not match actual higher timeframe candle highs/lows
- You might miss important wicks or gaps that occurred between chart timeframe bars
- **Always verify levels against actual higher timeframe charts before trading**
Welcome traders! This guide will walk you through the TREAD (Timeframe Resistance Evaluation And Detection) indicator, a multi-timeframe analysis tool developed by CoffeeKiller that identifies support and resistance confluence across different time periods.(I am 50+ year old trader and always thought I was bad a teaching and explaining so you get a AI guide. I personally use this on the 5 minute chart with the default settings, but to each there own and if you can improve the trend detection methods please DM me. I would like to see the code. Thanks)
Core Components
1. Dual Timeframe Level Tracking
- Short Timeframe Levels: Tracks opening price extremes within shorter periods
- Long Timeframe Levels: Tracks actual high/low extremes within longer periods
- Dynamic Reset Mechanism: Levels reset at the start of each new timeframe period
- Momentum Detection: Identifies when levels change mid-period, indicating active price movement
2. Visual Zone System
- High Zones: Areas between long timeframe highs and short timeframe highs
- Low Zones: Areas between long timeframe lows and short timeframe lows
- Fill Coloring: Dynamic colors based on whether levels are static or actively changing
- Momentum Highlighting: Special colors when levels break during active periods
3. Customizable Display Options
- Multiple Plot Styles: Line, circles, or cross markers
- Flexible Timeframe Selection: Wide range of short and long timeframe combinations
- Color Customization: Separate colors for each level type and momentum state
- Toggle Controls: Show/hide different elements based on trading preference
Main Features
Timeframe Settings
- Short Timeframe Options: 15m, 30m, 1h, 2h, 4h
- Long Timeframe Options: 1h, 2h, 4h, 8h, 12h, 1D, 1W
- Recommended Combinations:
- Scalping: 15m/1h or 30m/2h
- Day Trading: 30m/4h or 1h/4h
- Swing Trading: 4h/1D or 1D/1W
Display Configuration
- Level Visibility: Toggle short/long timeframe levels independently
- Fill Zone Control: Enable/disable colored zones between levels
- Momentum Fills: Special highlighting for actively changing levels
- Line Customization: Width, style, and color options for all elements
Color System
- Short TF High: Default red for resistance levels
- Short TF Low: Default green for support levels
- Long TF High: Transparent red for broader resistance context
- Long TF Low: Transparent green for broader support context
- Momentum Colors: Brighter colors when levels are actively changing
Technical Implementation Details
How Level Tracking Works
The indicator uses a custom tracking function that:
1. Detects Timeframe Periods: Uses `time()` function to identify when new periods begin
2. Tracks Extremes: Monitors highest/lowest values within each period
3. Resets on New Periods: Clears tracking when timeframe periods change
4. Updates Mid-Period: Continues tracking if new extremes are reached
The Timeframe Limitation Explained
`pinescript
// What the indicator does:
short_tf_start = ta.change(time(short_timeframe)) != 0 // Detects 30m period start
= track_highest(open, short_tf_start) // BUT uses chart TF opens!
// What true multi-timeframe would be:
// short_tf_high = request.security(syminfo.tickerid, short_timeframe, high)
`
This means:
- On a 5m chart with 30m/4h settings: Tracks 5m bar opens during 30m and 4h windows
- On a 1m chart with same settings: Tracks 1m bar opens during 30m and 4h windows
- Results will be different between chart timeframes
- May miss important price action that occurred between your chart's bars
Visual Elements
1. Level Lines
- Short TF High: Upper resistance line from shorter timeframe analysis
- Short TF Low: Lower support line from shorter timeframe analysis
- Long TF High: Broader resistance context from longer timeframe
- Long TF Low: Broader support context from longer timeframe
2. Zone Fills
- High Zone: Area between long TF high and short TF high (potential resistance cluster)
- Low Zone: Area between long TF low and short TF low (potential support cluster)
- Regular Fill: Standard transparency when levels are static
- Momentum Fill: Enhanced visibility when levels are actively changing
3. Dynamic Coloring
- Static Periods: Normal colors when levels haven't changed recently
- Active Periods: Momentum colors when levels are being tested/broken
- Confluence Zones: Different intensities based on timeframe alignment
Trading Applications
1. Support/Resistance Trading
- Entry Points: Trade bounces from zone boundaries
- Confluence Areas: Focus on areas where short and long TF levels cluster
- Zone Breaks: Enter on confirmed breaks through entire zones
- Multiple Timeframe Confirmation: Stronger signals when both timeframes align
2. Range Trading
- Zone Boundaries: Use fill zones as range extremes
- Mean Reversion: Trade back toward opposite zone when price reaches extremes
- Breakout Preparation: Watch for momentum color changes indicating potential breakouts
- Risk Management: Place stops outside the opposite zone
3. Trend Following
- Direction Bias: Trade in direction of zone breaks
- Pullback Entries: Enter on pullbacks to broken zones (now support/resistance)
- Momentum Confirmation: Use momentum coloring to confirm trend strength
- Multiple Timeframe Alignment: Strongest trends when both timeframes agree
4. Scalping Applications
- Quick Bounces: Trade rapid moves between zone boundaries
- Momentum Signals: Enter when momentum colors appear
- Short-Term Targets: Use opposite zone as profit target
- Tight Stops: Place stops just outside current zone
Optimization Guide
1. Timeframe Selection
For Different Trading Styles:
- Scalping: 15m/1h - Quick levels, frequent updates
- Day Trading: 30m/4h - Balanced view, good for intraday moves
- Swing Trading: 4h/1D - Longer-term perspective, fewer false signals
- Position Trading: 1D/1W - Major structural levels
2. Chart Timeframe Considerations
**Important**: Your chart timeframe affects results
- Lower Chart TF: More granular level tracking, but may be noisy
- Higher Chart TF: Smoother levels, but may miss important price action
- Recommended: Use chart timeframe 2-4x smaller than short indicator timeframe
3. Display Settings
- Busy Charts: Disable fills, show only key levels
- Clean Analysis: Enable all fills and momentum coloring
- Multi-Monitor Setup: Use different color schemes for easy identification
- Mobile Trading: Increase line width for visibility
Best Practices
1. Level Verification
- Always Cross-Check: Verify levels against actual higher timeframe charts
- Multiple Timeframes: Check 2-3 different chart timeframes for consistency
- Price Action Confirmation: Wait for candlestick confirmation at levels
- Volume Analysis: Combine with volume for stronger confirmation
2. Risk Management
- Stop Placement: Use zones rather than exact prices for stops
- Position Sizing: Reduce size when zones are narrow (higher risk)
- Multiple Targets: Scale out at different zone boundaries
- False Break Protection: Allow for minor zone penetrations
3. Signal Quality Assessment
- Momentum Colors: Higher probability when momentum coloring appears
- Zone Width: Wider zones often provide stronger support/resistance
- Historical Testing: Backtest on your preferred timeframe combinations
- Market Conditions: Adjust sensitivity based on volatility
Advanced Features
1. Momentum Detection System
The indicator tracks when levels change mid-period:
`pinescript
short_high_changed = short_high != short_high and not short_tf_start
`
This identifies:
- Active level testing
- Potential breakout situations
- Increased market volatility
- Trend acceleration points
2. Dynamic Color System
Complex conditional logic determines fill colors:
- Static Zones: Regular transparency for stable levels
- Active Zones: Enhanced colors for changing levels
- Mixed States: Different combinations based on user preferences
- Custom Overrides: User can prioritize certain color schemes
3. Zone Interaction Analysis
- Convergence: When short and long TF levels approach each other
- Divergence: When timeframes show conflicting levels
- Alignment: When both timeframes agree on direction
- Transition: When one timeframe changes while other remains static
Common Issues and Solutions
1. Inconsistent Levels
Problem: Levels look different on various chart timeframes
Solution: Always verify against actual higher timeframe charts
2. Missing Price Action
Problem: Important wicks or gaps not reflected in levels
Solution: Use chart timeframe closer to indicator's short timeframe setting
3. Too Many Signals
Problem: Excessive level changes and momentum alerts
Solution: Increase timeframe settings or reduce chart timeframe granularity
4. Lagging Signals
Problem: Levels seem to update too slowly
Solution: Decrease chart timeframe or use more sensitive timeframe combinations
Recommended Setups
Conservative Approach
- Timeframes: 4h/1D
- Chart: 1h
- Display: Show fills only, no momentum coloring
- Use: Swing trading, position management
Aggressive Approach
- Timeframes: 15m/1h
- Chart: 5m
- Display: All features enabled, momentum highlighting
- Use: Scalping, quick reversal trades
Balanced Approach
- Timeframes: 30m/4h
- Chart: 15m
- Display: Selective fills, momentum on key levels
- Use: Day trading, multi-session analysis
Final Notes
**Remember**: This indicator provides a synthetic view of multi-timeframe levels, not true higher timeframe data. While useful for identifying potential confluence areas, always verify important levels by checking actual higher timeframe charts.
**Best Results When**:
- Combined with actual multi-timeframe analysis
- Used for confluence confirmation rather than primary signals
- Applied with proper risk management
- Verified against price action and volume
**DISCLAIMER**: This indicator and its signals are intended solely for educational and informational purposes. The timeframe limitation means results may not reflect true higher timeframe levels. Always conduct your own analysis and verify levels independently before making trading decisions. Trading involves significant risk of loss.

Grothendieck-Teichmüller Geometric SynthesisDskyz's Grothendieck-Teichmüller Geometric Synthesis (GTGS)
THEORETICAL FOUNDATION: A SYMPHONY OF GEOMETRIES
The 🎓 GTGS is built upon a revolutionary premise: that market dynamics can be modeled as geometric and topological structures. While not a literal academic implementation—such a task would demand computational power far beyond current trading platforms—it leverages core ideas from advanced mathematical theories as powerful analogies and frameworks for its algorithms. Each component translates an abstract concept into a practical market calculation, distinguishing GTGS by identifying deeper structural patterns rather than relying on standard statistical measures.
1. Grothendieck-Teichmüller Theory: Deforming Market Structure
The Theory : Studies symmetries and deformations of geometric objects, focusing on the "absolute" structure of mathematical spaces.
Indicator Analogy : The calculate_grothendieck_field function models price action as a "deformation" from its immediate state. Using the nth root of price ratios (math.pow(price_ratio, 1.0/prime)), it measures market "shape" stretching or compression, revealing underlying tensions and potential shifts.
2. Topos Theory & Sheaf Cohomology: From Local to Global Patterns
The Theory : A framework for assembling local properties into a global picture, with cohomology measuring "obstructions" to consistency.
Indicator Analogy : The calculate_topos_coherence function uses sine waves (math.sin) to represent local price "sections." Summing these yields a "cohomology" value, quantifying price action consistency. High values indicate coherent trends; low values signal conflict and uncertainty.
3. Tropical Geometry: Simplifying Complexity
The Theory : Transforms complex multiplicative problems into simpler, additive, piecewise-linear ones using min(a, b) for addition and a + b for multiplication.
Indicator Analogy : The calculate_tropical_metric function applies tropical_add(a, b) => math.min(a, b) to identify the "lowest energy" state among recent price points, pinpointing critical support levels non-linearly.
4. Motivic Cohomology & Non-Commutative Geometry
The Theory : Studies deep arithmetic and quantum-like properties of geometric spaces.
Indicator Analogy : The motivic_rank and spectral_triple functions compute weighted sums of historical prices to capture market "arithmetic complexity" and "spectral signature." Higher values reflect structured, harmonic price movements.
5. Perfectoid Spaces & Homotopy Type Theory
The Theory : Abstract fields dealing with p-adic numbers and logical foundations of mathematics.
Indicator Analogy : The perfectoid_conv and type_coherence functions analyze price convergence and path identity, assessing the "fractal dust" of price differences and price path cohesion, adding fractal and logical analysis.
The Combination is Key : No single theory dominates. GTGS ’s Unified Field synthesizes all seven perspectives into a comprehensive score, ensuring signals reflect deep structural alignment across mathematical domains.
🎛️ INPUTS: CONFIGURING THE GEOMETRIC ENGINE
The GTGS offers a suite of customizable inputs, allowing traders to tailor its behavior to specific timeframes, market sectors, and trading styles. Below is a detailed breakdown of key input groups, their functionality, and optimization strategies, leveraging provided tooltips for precision.
Grothendieck-Teichmüller Theory Inputs
🧬 Deformation Depth (Absolute Galois) :
What It Is : Controls the depth of Galois group deformations analyzed in market structure.
How It Works : Measures price action deformations under automorphisms of the absolute Galois group, capturing market symmetries.
Optimization :
Higher Values (15-20) : Captures deeper symmetries, ideal for major trends in swing trading (4H-1D).
Lower Values (3-8) : Responsive to local deformations, suited for scalping (1-5min).
Timeframes :
Scalping (1-5min) : 3-6 for quick local shifts.
Day Trading (15min-1H) : 8-12 for balanced analysis.
Swing Trading (4H-1D) : 12-20 for deep structural trends.
Sectors :
Stocks : Use 8-12 for stable trends.
Crypto : 3-8 for volatile, short-term moves.
Forex : 12-15 for smooth, cyclical patterns.
Pro Tip : Increase in trending markets to filter noise; decrease in choppy markets for sensitivity.
🗼 Teichmüller Tower Height :
What It Is : Determines the height of the Teichmüller modular tower for hierarchical pattern detection.
How It Works : Builds modular levels to identify nested market patterns.
Optimization :
Higher Values (6-8) : Detects complex fractals, ideal for swing trading.
Lower Values (2-4) : Focuses on primary patterns, faster for scalping.
Timeframes :
Scalping : 2-3 for speed.
Day Trading : 4-5 for balanced patterns.
Swing Trading : 5-8 for deep fractals.
Sectors :
Indices : 5-8 for robust, long-term patterns.
Crypto : 2-4 for rapid shifts.
Commodities : 4-6 for cyclical trends.
Pro Tip : Higher towers reveal hidden fractals but may slow computation; adjust based on hardware.
🔢 Galois Prime Base :
What It Is : Sets the prime base for Galois field computations.
How It Works : Defines the field extension characteristic for market analysis.
Optimization :
Prime Characteristics :
2 : Binary markets (up/down).
3 : Ternary states (bull/bear/neutral).
5 : Pentagonal symmetry (Elliott waves).
7 : Heptagonal cycles (weekly patterns).
11,13,17,19 : Higher-order patterns.
Timeframes :
Scalping/Day Trading : 2 or 3 for simplicity.
Swing Trading : 5 or 7 for wave or cycle detection.
Sectors :
Forex : 5 for Elliott wave alignment.
Stocks : 7 for weekly cycle consistency.
Crypto : 3 for volatile state shifts.
Pro Tip : Use 7 for most markets; 5 for Elliott wave traders.
Topos Theory & Sheaf Cohomology Inputs
🏛️ Temporal Site Size :
What It Is : Defines the number of time points in the topological site.
How It Works : Sets the local neighborhood for sheaf computations, affecting cohomology smoothness.
Optimization :
Higher Values (30-50) : Smoother cohomology, better for trends in swing trading.
Lower Values (5-15) : Responsive, ideal for reversals in scalping.
Timeframes :
Scalping : 5-10 for quick responses.
Day Trading : 15-25 for balanced analysis.
Swing Trading : 25-50 for smooth trends.
Sectors :
Stocks : 25-35 for stable trends.
Crypto : 5-15 for volatility.
Forex : 20-30 for smooth cycles.
Pro Tip : Match site size to your average holding period in bars for optimal coherence.
📐 Sheaf Cohomology Degree :
What It Is : Sets the maximum degree of cohomology groups computed.
How It Works : Higher degrees capture complex topological obstructions.
Optimization :
Degree Meanings :
1 : Simple obstructions (basic support/resistance).
2 : Cohomological pairs (double tops/bottoms).
3 : Triple intersections (complex patterns).
4-5 : Higher-order structures (rare events).
Timeframes :
Scalping/Day Trading : 1-2 for simplicity.
Swing Trading : 3 for complex patterns.
Sectors :
Indices : 2-3 for robust patterns.
Crypto : 1-2 for rapid shifts.
Commodities : 3-4 for cyclical events.
Pro Tip : Degree 3 is optimal for most trading; higher degrees for research or rare event detection.
🌐 Grothendieck Topology :
What It Is : Chooses the Grothendieck topology for the site.
How It Works : Affects how local data integrates into global patterns.
Optimization :
Topology Characteristics :
Étale : Finest topology, captures local-global principles.
Nisnevich : A1-invariant, good for trends.
Zariski : Coarse but robust, filters noise.
Fpqc : Faithfully flat, highly sensitive.
Sectors :
Stocks : Zariski for stability.
Crypto : Étale for sensitivity.
Forex : Nisnevich for smooth trends.
Indices : Zariski for robustness.
Timeframes :
Scalping : Étale for precision.
Swing Trading : Nisnevich or Zariski for reliability.
Pro Tip : Start with Étale for precision; switch to Zariski in noisy markets.
Unified Field Configuration Inputs
⚛️ Field Coupling Constant :
What It Is : Sets the interaction strength between geometric components.
How It Works : Controls signal amplification in the unified field equation.
Optimization :
Higher Values (0.5-1.0) : Strong coupling, amplified signals for ranging markets.
Lower Values (0.001-0.1) : Subtle signals for trending markets.
Timeframes :
Scalping : 0.5-0.8 for quick, strong signals.
Swing Trading : 0.1-0.3 for trend confirmation.
Sectors :
Crypto : 0.5-1.0 for volatility.
Stocks : 0.1-0.3 for stability.
Forex : 0.3-0.5 for balance.
Pro Tip : Default 0.137 (fine structure constant) is a balanced starting point; adjust up in choppy markets.
📐 Geometric Weighting Scheme :
What It Is : Determines the framework for combining geometric components.
How It Works : Adjusts emphasis on different mathematical structures.
Optimization :
Scheme Characteristics :
Canonical : Equal weighting, balanced.
Derived : Emphasizes higher-order structures.
Motivic : Prioritizes arithmetic properties.
Spectral : Focuses on frequency domain.
Sectors :
Stocks : Canonical for balance.
Crypto : Spectral for volatility.
Forex : Derived for structured moves.
Indices : Motivic for arithmetic cycles.
Timeframes :
Day Trading : Canonical or Derived for flexibility.
Swing Trading : Motivic for long-term cycles.
Pro Tip : Start with Canonical; experiment with Spectral in volatile markets.
Dashboard and Visual Configuration Inputs
📋 Show Enhanced Dashboard, 📏 Size, 📍 Position :
What They Are : Control dashboard visibility, size, and placement.
How They Work : Display key metrics like Unified Field , Resonance , and Signal Quality .
Optimization :
Scalping : Small size, Bottom Right for minimal chart obstruction.
Swing Trading : Large size, Top Right for detailed analysis.
Sectors : Universal across markets; adjust size based on screen setup.
Pro Tip : Use Large for analysis, Small for live trading.
📐 Show Motivic Cohomology Bands, 🌊 Morphism Flow, 🔮 Future Projection, 🔷 Holographic Mesh, ⚛️ Spectral Flow :
What They Are : Toggle visual elements representing mathematical calculations.
How They Work : Provide intuitive representations of market dynamics.
Optimization :
Timeframes :
Scalping : Enable Morphism Flow and Spectral Flow for momentum.
Swing Trading : Enable all for comprehensive analysis.
Sectors :
Crypto : Emphasize Morphism Flow and Future Projection for volatility.
Stocks : Focus on Cohomology Bands for stable trends.
Pro Tip : Disable non-essential visuals in fast markets to reduce clutter.
🌫️ Field Transparency, 🔄 Web Recursion Depth, 🎨 Mesh Color Scheme :
What They Are : Adjust visual clarity, complexity, and color.
How They Work : Enhance interpretability of visual elements.
Optimization :
Transparency : 30-50 for balanced visibility; lower for analysis.
Recursion Depth : 6-8 for balanced detail; lower for older hardware.
Color Scheme :
Purple/Blue : Analytical focus.
Green/Orange : Trading momentum.
Pro Tip : Use Neon Purple for deep analysis; Neon Green for active trading.
⏱️ Minimum Bars Between Signals :
What It Is : Minimum number of bars required between consecutive signals.
How It Works : Prevents signal clustering by enforcing a cooldown period.
Optimization :
Higher Values (10-20) : Fewer signals, avoids whipsaws, suited for swing trading.
Lower Values (0-5) : More responsive, allows quick reversals, ideal for scalping.
Timeframes :
Scalping : 0-2 bars for rapid signals.
Day Trading : 3-5 bars for balance.
Swing Trading : 5-10 bars for stability.
Sectors :
Crypto : 0-3 for volatility.
Stocks : 5-10 for trend clarity.
Forex : 3-7 for cyclical moves.
Pro Tip : Increase in choppy markets to filter noise.
Hardcoded Parameters
Tropical, Motivic, Spectral, Perfectoid, Homotopy Inputs : Fixed to optimize performance but influence calculations (e.g., tropical_degree=4 for support levels, perfectoid_prime=5 for convergence).
Optimization : Experiment with codebase modifications if advanced customization is needed, but defaults are robust across markets.
🎨 ADVANCED VISUAL SYSTEM: TRADING IN A GEOMETRIC UNIVERSE
The GTTMTSF ’s visuals are direct representations of its mathematics, designed for intuitive and precise trading decisions.
Motivic Cohomology Bands :
What They Are : Dynamic bands ( H⁰ , H¹ , H² ) representing cohomological support/resistance.
Color & Meaning : Colors reflect energy levels ( H⁰ tightest, H² widest). Breaks into H¹ signal momentum; H² touches suggest reversals.
How to Trade : Use for stop-loss/profit-taking. Band bounces with Dashboard confirmation are high-probability setups.
Morphism Flow (Webbing) :
What It Is : White particle streams visualizing market momentum.
Interpretation : Dense flows indicate strong trends; sparse flows signal consolidation.
How to Trade : Follow dominant flow direction; new flows post-consolidation signal trend starts.
Future Projection Web (Fractal Grid) :
What It Is : Fibonacci-period fractal projections of support/resistance.
Color & Meaning : Three-layer lines (white shadow, glow, colored quantum) with labels showing price, topological class, anomaly strength (φ), resonance (ρ), and obstruction ( H¹ ). ⚡ marks extreme anomalies.
How to Trade : Target ⚡/● levels for entries/exits. High-anomaly levels with weakening Unified Field are reversal setups.
Holographic Mesh & Spectral Flow :
What They Are : Visuals of harmonic interference and spectral energy.
How to Trade : Bright mesh nodes or strong Spectral Flow warn of building pressure before price movement.
📊 THE GEOMETRIC DASHBOARD: YOUR MISSION CONTROL
The Dashboard translates complex mathematics into actionable intelligence.
Unified Field & Signals :
FIELD : Master value (-10 to +10), synthesizing all geometric components. Extreme readings (>5 or <-5) signal structural limits, often preceding reversals or continuations.
RESONANCE : Measures harmony between geometric field and price-volume momentum. Positive amplifies bullish moves; negative amplifies bearish moves.
SIGNAL QUALITY : Confidence meter rating alignment. Trade only STRONG or EXCEPTIONAL signals for high-probability setups.
Geometric Components :
What They Are : Breakdown of seven mathematical engines.
How to Use : Watch for convergence. A strong Unified Field is reliable when components (e.g., Grothendieck , Topos , Motivic ) align. Divergence warns of trend weakening.
Signal Performance :
What It Is : Tracks indicator signal performance.
How to Use : Assesses real-time performance to build confidence and understand system behavior.
🚀 DEVELOPMENT & UNIQUENESS: BEYOND CONVENTIONAL ANALYSIS
The GTTMTSF was developed to analyze markets as evolving geometric objects, not statistical time-series.
Why This Is Unlike Anything Else :
Theoretical Depth : Uses geometry and topology, identifying patterns invisible to statistical tools.
Holistic Synthesis : Integrates seven deep mathematical frameworks into a cohesive Unified Field .
Creative Implementation : Translates PhD-level mathematics into functional Pine Script , blending theory and practice.
Immersive Visualization : Transforms charts into dynamic geometric landscapes for intuitive market understanding.
The GTTMTSF is more than an indicator; it’s a new lens for viewing markets, for traders seeking deeper insight into hidden order within chaos.
" Where there is matter, there is geometry. " - Johannes Kepler
— Dskyz , Trade with insight. Trade with anticipation.

LiquidEdge Original1️⃣ Why Most Traders Miss Key Market Turning Points
Most traders (you) struggle to identify true market pivots THE REAL TOP and BOTTOMS where reversals begin.
❌ You enter too early or too late because price alone doesn’t give enough confirmation
❌ You follow price blindly, unaware of the volume pressure building underneath
❌ You get caught in sideways markets, not realizing they’re often accumulation or distribution zones
❌ You can’t tell if momentum is building or fading, which leads to low confidence and inconsistent results
👉 LiquidEdge helps solve this by tracking volume momentum through a modified MFI slope and scoring system. It highlights potential pivots with real context, so you can see where smart money might be entering or exiting before price makes it obvious.
2️⃣ What LiquidEdge Actually Does and How
LiquidEdge helps solve common trading problems by adding structure and clarity to volume analysis.
✅ It builds on the classic Money Flow Index (MFI), but instead of just showing overbought/oversold levels, it calculates the slope of MFI to track real-time changes in volume momentum
✅ Each setup is scored based on a combination of factors: divergence strength, trend alignment using EMA, and whether the signal occurs inside a liquidity zone
✅ Hidden accumulation or distribution is revealed when volume pressure increases or fades while price remains flat or moves slightly, a sign of smart money positioning
✅ Divergences are only flagged when they occur near pivot zones and align with overall trend conditions, helping reduce false signals
✅ Potential pivots are identified when multiple factors overlap such as a liquidity zone breach, volume slope shift, and valid divergence which often signals entry or exit points for institutional players
👉 The result is a structured interpretation of price and volume flow, helping traders read momentum shifts and potential reversals more clearly in both trending and ranging markets.
3️⃣ What Makes LiquidEdge Different
LiquidEdge is built on top of the classic Money Flow Index (MFI), but adds structure that transforms it from a basic momentum tool into a decision-support system.
Instead of simply showing highs and lows, it scores each potential setup based on:
✅ The steepness and direction of the MFI slope (used to measure volume pressure)
✅ Whether the setup aligns with the broader trend using an EMA filter (default: 200 EMA)
✅ Whether the signal appears inside predefined liquidity zones (MFI above 80 or below 20)
👉 This scoring system reduces noise and helps you focus only on high-probability setups.
👉 It also checks volume pressure across multiple timeframes using MFI slope on 5M, 15M, 1H, 4H, and Daily charts. This reveals whether short-term moves are backed by longer-term volume momentum.
Color changes in the line and histogram are not decorative they reflect real shifts in volume pressure. Every visual cue is linked to live market logic.
What Makes It Stand Out
👉 Setup Scoring That Makes Sense
Each setup is scored by combining:
Signal strength (MFI slope intensity and stability)
Trend direction (via customizable EMA)
Liquidity zone relevance (MFI range filtering)
This structured scoring means you spend less time second-guessing and more time reading clean signals.
👉 Flow That Follows Real Momentum
The slope of the MFI tracks whether volume pressure is rising or falling:
🟢 Green = increasing inflow (buying pressure)
🔴 Red = increasing outflow (selling pressure)
👉 Multi-Timeframe Volume Context
LiquidEdge calculates flow direction independently on each major timeframe. You’ll know if short-term setups are confirmed by higher timeframe volume or going against it.
👉 Smart Divergence Filtering
Unlike simple divergence tools that compare price highs/lows directly, LiquidEdge filters divergences based on:
Local pivot zones (defined by lookback periods)
Trend confirmation (to eliminate countertrend noise)
4️⃣ How LiquidEdge Works (Under the Hood)
LiquidEdge tracks directional momentum using the slope of the Money Flow Index (MFI) giving you a real-time read on buying and selling pressure.
When the slope rises, it means buyers are stepping in and volume is supporting the move.
When it falls, sellers are taking control and volume outflow is increasing.
This slope acts like a pressure gauge for the market, helping you spot when a trend has strength or when it's starting to fade.
💡 Quick Comparison
RSI = momentum from price
MFI = momentum from price + volume
LiquidEdge takes it one step further by calculating the rate of change (slope) in MFI. That’s where the pressure signal comes from not just value, but directional flow.
Core Calculations (Simplified)
Typical Price = (High + Low + Close) ÷ 3
Raw Money Flow = Typical Price × Volume
MFI = 100 −
MFI ranges from 0 to 100.
High = strong buying volume
Low = growing selling pressure
LiquidEdge then calculates the slope of this MFI over time to track volume momentum dynamically.
Divergence Engine
LiquidEdge detects divergence by comparing price pivots with the direction of MFI slope.
❌ If price makes a higher high but MFI slope turns down, it’s a bearish divergence
✅ If price makes a lower low but MFI slope rises, it’s a bullish divergence
Divergences are only confirmed when they occur:
Near local pivot zones (defined by configurable lookback windows)
And, optionally, in alignment with the broader trend using an EMA filter
This filtering helps reduce false positives and keeps you focused on clean setups.
Structured Confidence Scoring
Each signal is visually scored based on:
➡️ Whether a valid divergence is detected
➡️ Whether the signal occurs inside a liquidity zone (MFI > 80 or < 20)
➡️ Whether the setup aligns with the overall trend direction (EMA filter)
More confluence = higher confidence
The scoring system helps prioritize setups that meet multiple criteria, not just one.
Liquidity Zones
Above 80: Signals possible buying exhaustion 👉 risk of reversal
Below 20: Indicates potential selling exhaustion 👉 watch for a bounce
Zones are shaded directly on the chart to highlight pressure extremes in real time.
Price + Volume Fusion
LiquidEdge blends price action with volume pressure using MFI slope and histogram behavior. It doesn’t just show you where price is moving. it shows whether the move is backed by real volume.
This lets you see:
Whether volume is confirming or fading behind a move
If a reversal is building even before price confirms it
Visual Feedback That Speaks Clearly
🟢 Green slope = increasing buying pressure
🔴 Red slope = increasing selling pressure
5️⃣ When Price Is Flat but LiquidEdge Moves: Volume Tells the Truth
One of the most useful things LiquidEdge can do is reveal pressure shifts when price looks neutral.
If price is moving sideways but the MFI slope or histogram rises, it may suggest that buying pressure is quietly increasing possibly pointing to early accumulation.
If price stays flat while the volume slope or histogram drops, this could indicate distribution, where sellers are exiting without moving the market noticeably.
These changes don’t guarantee a breakout or breakdown, but they often precede key moves especially when combined with other confluences like trend alignment or liquidity zones.
👉 LiquidEdge helps spot these setups by measuring volume momentum shifts beneath price action.
It doesn’t predict the future, but it gives you additional context to evaluate what may be developing before it’s visible on price alone.
6️⃣ Multi-Timeframe Flow Table
LiquidEdge includes a real-time table that tracks volume pressure across multiple timeframes including 5-minute, 15-minute, 1-hour, 4-hour, and daily charts.
Each row reflects the direction of the MFI slope on that timeframe, indicating whether volume pressure is increasing (inflow) or decreasing (outflow).
🟢 A rising slope suggests that buying momentum is building
🔴 A falling slope suggests selling pressure may be increasing
👉 This lets traders quickly assess whether short-term setups are aligned with higher timeframe volume trends a useful layer of confirmation for both intraday and swing strategies.
Rather than flipping between charts, the table gives you a snapshot of flow strength across the board, helping you stay focused on opportunities that align with broader market pressure.
7️⃣ Timeframes & Assets
Where LiquidEdge Works Best:
✅ Crypto: Supports major coins and high-volume altcoins (BTC, ETH, Top 100)
✅ Stocks: Effective on large-cap and mid-cap equities with consistent volume
✅ Futures: Tested on instruments like NQ, MNQ, ES, and MES
✅ Any liquid market where volume data is reliable and stable
For best results, use LiquidEdge on assets with consistent trading volume. It’s not recommended for ultra-low volume crypto pairs or micro-cap stocks, where irregular volume can distort signals.
Recommended Timeframes:
👉 Intraday trading: Works well on 3-minute, 5-minute, 15-minute, and 1-hour charts
👉 Swing trading: Performs reliably on 4-hour, daily, and weekly charts
👉 Ultra short-term (1-minute or less): Not recommended due to high noise and low reliability
LiquidEdge adapts to various trading styles from scalping short-term momentum shifts to analyzing broader volume trends across swing and positional setups. The key is choosing assets and timeframes with reliable volume flow for the tool to work effectively.
8️⃣ Common Mistakes to Avoid When Using LiquidEdge
❌ Using It in Isolation
LiquidEdge offers valuable context, but it’s not designed to function as a standalone trading system. Always combine it with key tools such as trendlines, support/resistance zones, chart structure, or fundamental data. The more supporting evidence you have, the stronger your analysis becomes.
❌ Relying on a Single Indicator
No indicator, including LiquidEdge, can account for every market condition. It’s important to use it alongside other forms of confirmation to avoid making decisions based on limited data.
❌ Misinterpreting Divergences as Reversals
A divergence between price and volume pressure doesn't always signal the end of a trend. If the broader direction remains strong (based on EMAs or higher timeframe volume flow), a divergence could reflect temporary consolidation rather than reversal.
❌ Ignoring Trend Alignment and Confidence Scoring
LiquidEdge includes confidence scoring to help validate signals. Disregarding this structure can lead to reacting to weak or out-of-context divergences, especially in choppy or low-volume environments.
❌ Using It on Second-Based or Tick Charts
Very low timeframes introduce too much noise, which can distort volume slope and divergence signals. For intraday analysis, start with 3-minute charts or higher. For swing trading, use 4H and up for clearer, more reliable structure.
9️⃣ LiquidEdge Settings Overview
A quick breakdown of what you can customize in the indicator and how each option affects what you see:
➡️ LiquidEdge Length
Controls how sensitive the indicator is to changes in volume pressure (via MFI slope).
Shorter values = faster response, more frequent signals
Longer values = smoother output, less noise
👉 Default: 14
➡️ EMA Trend Filter
Determines overall trend direction based on EMA slope. Used to filter out signals that go against the broader move.
Helps reduce countertrend entries
Adjustable to suit your strategy
👉 Recommended: 200 EMA
➡️ Pivot Lookback (Left & Right)
Defines how many bars the system looks back and forward to identify swing highs/lows for divergence detection.
Narrow: more responsive but can be noisy
Wide: slower but more stable pivot zones
👉 Default: 5 left / 5 right
➡️ Histogram Toggle
Enables a visual histogram showing how volume pressure deviates from its recent average.
Useful for spotting shifts in flow intensity
👉 Optional for added visual detail
➡️ Liquidity Zones
Highlights potential exhaustion zones based on MFI value:
Above 80 = potential distribution (buying pressure peaking)
Below 20 = possible accumulation (selling pressure fading)
👉 Zones are fully customizable (color, opacity, background)
➡️ Custom Threshold Zones
Set your own upper/lower boundaries for liquidity extremes helpful when adapting to different markets or asset classes.
👉 Especially useful outside of crypto/forex
➡️ Show LiquidEdge Line
Toggle the main MFI slope line. When turned off, liquidity zones and levels also disappear.
👉 Use if you prefer to focus only on histogram/divergences
➡️ Style Settings
Customize line colors, histogram appearance, and background shading
👉 Helps tailor visuals to your chart layout
➡️ Simplified Mode
Removes all colors and replaces visuals with a clean, grayscale output.
👉 Ideal for minimalist or distraction-free charting
➡️ Signal Score Label
Displays the confidence score of the current setup, based on:
Divergence presence
Liquidity zone positioning
Trend alignment (EMA)
👉 Tooltip explains how the score is calculated
➡️ Divergence Labels
Shows “Bullish” or “Bearish” labels at divergence points.
Optional Filters based on trend if EMA filter is active
➡️ Multi-Timeframe Flow Table
Shows directional flow (based on MFI slope) across: 5M, 15M, 1H, 4H, 1D
Color-coded (faded green/red) for clarity
👉 Table position is customizable on your chart
➡️ Alerts
Get notified when any of these conditions are met:
✅ Bullish or bearish divergence detected
✅ Price enters high/low liquidity zones
✅ Signal score reaches a defined value
➡️ Visibility Settings
Control which timeframes display the LiquidEdge indicator
👉 Best used on 3-minute and above
⚠️ Not recommended on ultra-low or second-based charts due to noise
🔟 Q&A – What Traders Usually Ask
➡️ Can this help reduce bad trades?
To a degree, yes. LiquidEdge is built to highlight areas where price may react, based on volume pressure, liquidity zones, and divergence patterns. It can offer clarity in sideways or messy markets, helping traders avoid impulsive or poorly timed entries.
That said, it’s not predictive or guaranteed. It works best when used with broader context including structure, support/resistance, trend, and volume-based confluence.
👉 Reminder: LiquidEdge is not a signal tool. It’s a decision-support framework designed to help you assess potential shifts, not replace judgment or trading rules.
➡️ Is this just another flashy signal tool?
No. LiquidEdge doesn’t give buy/sell alerts. Instead, it visualizes volume shifts using MFI slope, divergence filtering, and trend-based scoring. It’s built to help you understand why price action may be changing not just react to a one-dimensional signal.
You’re seeing how volume pressure evolves across timeframes, which gives added context to what’s unfolding in the market.
➡️ How do I know this isn’t just another overhyped tool?
LiquidEdge is based on real trading logic: volume pressure (via MFI slope), price behavior, and divergence within trend and liquidity zones. It was developed and tested by traders, not packaged by marketers.
No performance is guaranteed. It’s designed to support your decisions not promise results.
➡️ Will this work with my trading style?
If you trade any market with volume crypto, stocks, or futures LiquidEdge can add value.
✔️ Scalpers: Best from 3-minute and up
✔️ Swing traders: Works well on 4H, Daily, Weekly
✔️ Investors: Weekly charts show pressure buildup over time
⚠️ Avoid ultra-low timeframes (under 1M) or illiquid markets, as noise and irregular data can reduce reliability.
➡️ Can I trust the signals?
These are not buy/sell signals. LiquidEdge offers confidence-weighted insights based on:
✔️ Valid divergence
✔️ Zone positioning (above 80 / below 20)
✔️ Optional trend alignment (via EMA)
Each setup is scored visually to reflect how much confluence exists. You can combine that information with structure, price action, or your existing tools to evaluate opportunities.
👉 Think of LiquidEdge as a decision filter not a trigger.
It’s meant to slow down impulsive trades and help you make more context-aware decisions.
1️⃣1️⃣ Limitations – Know When It’s Less Effective
LiquidEdge performs best in stable, high-volume markets where volume data is consistent and structure is visible.
It’s not recommended for:
❌ Low-volume tokens
❌ Micro-cap or penny stocks
❌ Newly listed assets with limited trading history
These types of markets often show inconsistent or erratic volume behavior, making it difficult for LiquidEdge to accurately assess pressure or identify reliable divergences.
⚠️ During major news events or sudden volatility spikes, volume and price behavior can become disconnected or extreme. This may distort MFI slope calculations and reduce the accuracy of divergence or confidence scoring.
LiquidEdge is built to read structured volume flow. When market conditions become highly erratic or unpredictable, it's best to:
Wait for structure to return
Use it alongside other filters for additional confirmation
This isn't a flaw it's simply the nature of tools that rely on consistency in price and volume data.
1️⃣2️⃣ Real Chart Examples – See It in Action
Now that you’ve seen how LiquidEdge works, here are real-world chart examples from various asset classes
including:
✅ Crypto
✅ Stocks
✅ Futures
✅ Commodities
These examples demonstrate how LiquidEdge behaves under different conditions, and how both the line (MFI slope) and histogram (volume deviation) can be used to interpret market flow.
In each walkthrough, you’ll see:
How the histogram can highlight potential momentum shifts
When the slope line provides stronger directional clarity
Examples of possible hidden accumulation or distribution (before price responds)
What to watch out for such as weak volume, false divergences, or conflicting flow signals
👉 These are real examples based on live market data not theoretical setups. They’re meant to help you recognize how LiquidEdge reacts across multiple styles and timeframes.
Let’s walk through each one and break down the logic step by step, so you can understand how to evaluate setups using structure, volume behavior, and context-driven confluence.
Example: Microsoft (MSFT) – Possible Hidden Accumulation
In this setup, price was moving lower within a short-term downtrend. However, LiquidEdge began showing signs of increasing inflow pressure a common characteristic of accumulation, where volume rises even as price declines.
This divergence suggested that buying interest may have been increasing behind the scenes, despite weak price action on the surface.
Step-by-step breakdown:
👉 Trend context – Price was clearly trending down at the time
👉 Volume divergence – Price made lower lows, but LiquidEdge slope was rising = possible bullish divergence
👉 Accumulation clue – The rising slope, despite falling price, pointed to volume inflow often seen during quiet accumulation
👉 Histogram support – Volume pressure (via the histogram) also increased, confirming the flow shift
👉 Anticipating reaction – When liquidity pressure rises ahead of price, it can signal potential reversal interest
In this case, price later moved sharply higher. While not guaranteed, setups like this illustrate how divergence + volume flow may help highlight early accumulation zones before price confirms the shift.
Same Setup – Focusing on the Histogram Alone
Here, we’re revisiting the Microsoft setup but this time focusing only on the histogram, without the MFI slope line.
Even without the directional slope, the histogram showed rising volume pressure while price continued to drift lower. This visual pattern may indicate that buying interest was quietly increasing, despite weak price movement.
This is where the histogram adds value: it helps visualize the intensity of volume flow over time. When volume pressure builds during a flat or declining price phase, it can be consistent with accumulation where larger participants begin positioning before the market responds.
This example highlights how the histogram alone can provide early insight into underlying volume dynamics even before price shifts noticeably.
Filtering with EMA and why It Matters
Here, we revisit the Microsoft example this time applying the 200 EMA filter, which helps define the broader trend.
Once enabled, LiquidEdge automatically removed any bullish or bearish divergence signals that were against the prevailing trend. This helped reduce noise and focus only on setups aligned with market structure.
✅ The EMA acts as a contextual filter.
For example, if a bullish divergence occurs during a confirmed downtrend, LiquidEdge suppresses that signal helping you avoid setups that may carry more risk.
This filtering mechanism is especially useful in fast or choppy markets, where not all divergences are meaningful.
Want More Flexibility? Adjust the Filter
If you're a more aggressive trader or prefer shorter-term signals, you can reduce the EMA length (e.g., to 150, 50, or even 25). This increases the number of setups shown but also raises the importance of additional context and confirmation.
⚠️ Keep in mind:
❌ More signals doesn’t always mean better outcomes
✅ Focused, context-aware signals tend to be more consistent with broader market pressure
If you’re using this in combination with strategies like options trading, this filter can help refine your entry zones especially when paired with other structure or volatility tools.
Distribution Example and Bitcoin Setup Before a Major Drop
In this example, Bitcoin was trading in a relatively tight range while price continued to push upward. However, LiquidEdge began to show signs of volume outflow, which can suggest potential distribution.
Here’s what was observed:
🔴 Price was moving up inside a horizontal range
🔴 LiquidEdge’s slope indicated declining volume pressure
🔴 Several bearish divergence signals appeared during this consolidation phase
🔴 The histogram also showed weakening flow, even before price broke down
These overlapping signals pointed to a possible distribution phase, where buying momentum was fading despite price still holding up.
🧭 Signs to Watch for in Potential Distribution:
1️⃣ Price holding flat or rising slightly within a tight range
2️⃣ Volume pressure (line or histogram) sloping downward
3️⃣ Repeated bearish divergences forming at the highs
4️⃣ Lack of follow-through on bullish setups signaling hesitation in demand
While LiquidEdge can’t predict market outcomes, this scenario demonstrates how a combination of divergence, outflow, and failure to break out may serve as early warnings that momentum is shifting beneath the surface.
Failed Auction Example – Volume Shift Before a Breakdown
In this example, price attempted to break out above a recent high, creating the appearance of a bullish continuation. However, LiquidEdge began to signal volume outflow, despite the upward price move a potential sign of a failed auction.
Here’s what was observed:
👉 Price made a new high, appearing to break resistance
👉 LiquidEdge slope and histogram both showed declining liquidity
👉 The indicator formed lower lows, even as price pushed higher
👉 This divergence suggested that volume wasn’t supporting the breakout
Shortly after, price reversed and returned back inside the range which is a common characteristic of failed auction behavior.
🧭 Spotting a Potential Failed Auction with LiquidEdge:
1️⃣ Price breaks above a recent high
2️⃣ Volume flow (line + histogram) shows outflow, not inflow
3️⃣ Indicator forms lower lows while price makes higher highs (bearish divergence)
4️⃣ Market reverts back into the previous range without follow-through
While no tool can predict outcomes, this setup demonstrated how volume pressure and divergence can help identify moments where a breakout may lack real support offering context before price action confirms the shift.
Reading the Histogram - Spotting Pressure Fades
In this example, price was still rising but the LiquidEdge histogram showed falling volume pressure. This type of divergence between price and volume can serve as a potential early signal that momentum may be fading.
🔻 Histogram levels declined while price continued higher
🔻 This suggested that buying pressure was weakening, even though price hadn’t turned
🔻 Volume flow behavior didn’t support the continuation possibly indicating buyer exhaustion
Just before the peak, the histogram nearly reached its lower threshold, despite price still being near its highs.
💡 How to Read It:
When volume pressure (shown by the histogram) starts to fade while price is still rising, it can indicate that momentum is weakening. This may precede a pullback or reversal particularly if other factors like divergence or zone exhaustion are also present.
Conversely, rising histogram values during a price drop may suggest potential accumulation.
👉 Use the histogram as a volume intensity gauge, not a signal on its own especially when evaluating whether a move is supported by actual flow, or just price momentum.
The Table – Fast, Visual Multi-Timeframe Flow Insight
The multi-timeframe flow table in LiquidEdge provides a consolidated view of volume momentum across several key timeframes so you don’t need to switch between charts to compare flow strength.
👉 Instead of flipping from 5-minute to 15M, 1H, 4H, and Daily, the table displays flow direction on all of them at a glance.
Example layout:
🔼 Daily: Up
🔽 1H: Down
🔼 15M: Up
🔽 5M: Down
This setup gives you a quick read on whether volume momentum is aligned across multiple timeframes or diverging which can help frame your trade approach.
🧠 Why It’s Useful:
✅ Supports timeframe alignment
If higher timeframes show strong inflow while lower ones are mixed, you may interpret it as a swing-based opportunity. If short timeframes show pressure but higher frames are flat, it might suggest short-term setups with caution.
✅ Improves context awareness
Instead of interpreting a move in isolation, the table helps you assess whether short-term signals are part of a broader shift or going against higher timeframe flow.
💡 Pro Tip: Use the table as a starting point in your analysis. It’s a simple but effective snapshot of current liquidity pressure across the board helping you plan trades with broader context, rather than reacting chart-by-chart.
🔚 Final Thoughts
If you're focused on trading with better clarity and structure, LiquidEdge is designed to help you interpret what’s happening beneath the surface not just follow price movement.
While many tools highlight price alone, LiquidEdge combines volume pressure, divergence filtering, and trend-based context to help identify potential areas of accumulation, distribution, or momentum shifts even before they become obvious on a chart.
👉 This isn’t just another signal tool. It’s a framework to support smarter decision-making:
✔️ One that helps you filter out noise
✔️ One that scores setups using multiple layers of confirmation
✔️ One that brings volume context into every trade idea
Whether you're scalping on a 5-minute chart or managing a longer-term swing trade, LiquidEdge is built to help you stay aligned with volume-driven behavior not just react to price alone.
If you've struggled with late entries, unreliable setups, or second-guessing trades, this tool was designed to bring more structure to your process. It won’t remove all uncertainty but it can help you stay more selective, confident, and intentional.
✅ Trade with clarity
✅ Stay process-driven
✅ Focus on structure, not noise
LiquidEdge is not meant to replace your strategy. It’s here to enhance it.
In this chart, the 200 EMA filter was applied. As a result, only signals that aligned with the dominant trend direction were displayed helping to reduce distractions and focus on setups with stronger context.
💡 Using a higher EMA setting like 200 can reduce the number of signals shown, but may help you focus on higher-conviction opportunities.
That said, every trader is different:
Longer EMAs = fewer signals, but more trend-filtered setups
Shorter EMAs = more signals, faster entries but with potentially more noise
👉 Adjust the filter based on your trading style. Use a 200 EMA for swing trading, or reduce it to 50, 25, or even 5 if you're trading more aggressively or intraday.
LiquidEdge adapts to you not the other way around.
🔁 Adjusting EMA for Your Trading Style
Personal Tip: When trading more aggressively, I often use a 5 EMA filter especially when combining histogram strength with other tools. This increases signal responsiveness and may help highlight short-term flow shifts more quickly.
Below are visual examples that show how different EMA lengths impact the behavior of LiquidEdge:
50 EMA ON
25 EMA ON
5 EMA ON
Lower EMA Example – Gold with the 5 EMA
In this example, the 5 EMA filter was applied to Gold. As expected, more signals were plotted compared to higher EMA settings. The tool became more responsive to rapid shifts in volume momentum, making it more suitable for fast-paced trading environments.
This setting can help traders who prefer early entries but it also introduces more sensitivity, so context and additional confirmation become even more important.
Each setting affects signal frequency and filtering:
Higher EMA → fewer signals, more trend-confirmed setups
Lower EMA → more signals, quicker responses, but with more potential for noise
Choose what fits your approach:
Long-term swing → Stick with 200 EMA
Intraday or scalping → Consider shorter EMAs (50, 25, or 5)
💡 Reminder: EMA filtering is fully adjustable. LiquidEdge doesn’t lock you into one trading style it’s meant to adapt to your process, whether you’re swing trading or scalping short-term moves.
But There’s a Catch…
Using a lower EMA setting (like 5) opens up faster, more frequent signals but it also increases the need for precision and stronger trade management.
❗ More signals = More responsiveness
❗ Faster setups mean quicker decisions
❗ Risk control becomes even more important
💡 Lower Timeframes = More Detail, Less Margin for Error
A short EMA (like 5) can help you:
✅ Identify early momentum shifts
✅ Respond before traditional trend-followers
✅ Highlight short-term divergence and volume changes
But it also comes with tradeoffs:
❌ Greater signal noise
❌ Higher potential for misreads or fakeouts
❌ Requires clear structure and disciplined entries
🚩 Watch Out for Liquidity Grabs
In lower timeframes, a common trap is the liquidity grab where price pushes beyond recent highs or lows, triggers stops, then quickly reverses.
📌 These moves can look like breakouts, but often reverse quickly possibly reflecting institutional order placement or low-liquidity manipulation.
🧭 How to Approach It Smartly
✅ Use structure: Mark support and resistance to frame moves
✅ Confirm volume behavior: Is histogram strength rising or fading?
✅ Avoid chasing: Look for confluence, not just a single signal
✅ Be intentional with stops: Place them with structure in mind to avoid being swept out
NASDAQ Futures Example – Low Timeframe Setups with LiquidEdge
In this example, we look at how LiquidEdge was used to identify both short and long setups on the NASDAQ Futures (NQ) particularly on a low timeframe (5M), where quick decision-making and volume precision matter most.
⚠️ A Note on Futures and Volume
When trading futures, especially on intraday charts, it’s important to separate overnight volume from regular session activity.
🕒 Overnight Volume ≠ Real Volume Context
Overnight price action is informative, but the volume data itself may not reflect true market participation. In LiquidEdge, histogram and pressure calculations emphasize regular session flow helping avoid skewed signals that could come from low-volume overnight moves.
Using the Histogram to Spot Potential Shifts
One of the key cues I use is color transition in the histogram:
🔴 A flip from strong green to red can signal fading buying pressure, sometimes marking the beginning of a potential short setup.
🟢 A shift from red to green may indicate that buyers are returning, suggesting possible accumulation.
These shifts serve as early visual cues of changing pressure especially when confirmed by other tools or context.
🔁 Adding Context with the Line + Structure
After spotting a histogram shift, I look at:
1️⃣ Slope Line – Is it confirming the same directional pressure?
2️⃣ Support/Resistance – Are we near a meaningful zone?
3️⃣ Additional Tools – This includes trendlines, VWAP, EMAs, and overall price structure.
On lower timeframes like 5M, these pieces become even more important. LiquidEdge gives directional insight, but your full setup provides confirmation and execution logic.
⚠️ Disclaimer
LiquidEdge is not a signal tool. It’s a visual representation of market pressure and flow designed to help you make more informed trading and investing decisions. It shows you what’s happening beneath the price action but you are still responsible for your decisions.
Always combine LiquidEdge with your own strategy, research, and supporting tools. That includes trend analysis, support/resistance levels, chart patterns, and fundamentals (like P/E ratios, price-to-sales, debt ratios, etc.).
This tool should never be used alone or treated as financial advice.
Some content may include AI-powered enhancements for clarity or formatting.
Always do your own research. For personal financial guidance, speak with a licensed financial advisor.

bands ⚡ What This Script Does
This is a structured trading system specifically designed for navigating Bitcoin cycles and identifying higher-probability buy setups.
It is not a simple combination of public indicators instead, it applies a rules-based logic to adapt signals dynamically depending on the current market phase (bull/bear), while also using a triple confirmation framework (macro trend + volatility bands + buy signals).
This approach aims to reduce false signals and align trading decisions with Bitcoin’s well-known cyclical behavior.
⚡ Core Concept & Components
The system combines three complementary elements:
A macro trend filter band (red/green), shown at the bottom of the chart, representing Bitcoin’s macro trend environment.
Adaptive volatility bands using advanced smoothing techniques including HMA, KAMA, WVMA, combined with moving average (MA) and average true range (ATR) logic to capture dynamic “cheap” and “expensive” price zones. These bands adapt to Bitcoin’s volatility structure better than standard Bollinger Bands or SMA plus ATR setups.
Multi-timeframe RSI-based Buy Signals on 8h, 1D, 1W, and 1M timeframes historically calibrated for Bitcoin cycles.
These components work together through a rules-based process, dynamically adapting signal validity depending on the macro trend state.
⚡ Signal System and how to use
The red and green band at the bottom of the chart represents Bitcoin’s macro trend environment:
Light Green → Likely start of a bull market
Dark Green → Market is bullish but becoming extended; potentially nearing a local top
Red → Bear market conditions
Our trading approach uses four distinct BUY signals, depending on the market phase:
Red (8h) → weak buy signal
Yellow (1D) → medium buy signal
Green (1W) → strong buy signal
Blue (1M) → strongest buy signal
However, Day Trading and Swing Trading signals are automatically blocked during bear markets (Red Band).
Reason: low timeframe signals (1 minute to 1 day) tend to perform poorly in bear markets, as major bottoms typically form on higher timeframes (1 week or 1 month).
Therefore, during Red Band conditions, only Buy Bear Market and Buy Recession signals remain active.
to use it correctly you must go to configuration of the indicator, section input and enable 4 buy signals and check every day timefarme 8h 1d 1w and 1m.
⚡ Invalidation Conditions
To exit the bear market, the system includes an invalidation condition:
If the price closes above a specific SMA on a defined timeframe, the Red Band switches to Green → signaling a potential market recovery.
Additionally, for the Red Band to activate initially, the system requires that:
Price must break below a specific Hull Moving Average (HMA) on a defined timeframe and length.
⚡ Why These 3 Indicators Work Well Together
If the band is green (bull market conditions) and a Buy signal (any color) appears → it is generally safer to buy in a bull market than in a bear market.
(I’m trying to apply the famous phrase "the trend is your friend" in this trading indicator and trading strategy.)
If the price is also touching the lower green band, and a Buy signal appears → the buy becomes even more reliable, as you are combining big trend plus band support plus signal confirmation.
This gives you triple confirmation:
Band color plus band level touch plus Buy signal → increasing the probability that the trade is going to work.
By combining:
Blocking low timeframe signals during bear markets
Using a clear invalidation point to detect recovery
Requiring a structural break via HMA to enter a bear market phase, and requiring a break above a specific SMA (length and timeframe) to enter a bull market
Applying a triple confirmation logic when conditions are favorable
→ this framework helps you navigate Bitcoin markets more securely and profitably than using unfiltered signals alone.
⚡ Why It’s Not a Simple Mashup
The logic of the system is not just an overlay of RSI, moving averages and bands:
It applies a structured "state machine" logic:
Macro Band determines which signals are allowed.
Band-level touches condition the strength of signals.
Triple confirmation (macro trend plus band level plus signal) governs high-probability setups.
Invalidation points (SMA breakouts) dynamically switch macro state, ensuring no lagging bull signals in a bear market or vice versa.
This makes the system superior to using public domain components in isolation, as those do not provide dynamic signal filtering nor respect Bitcoin’s macro cyclicality explicitly.
⚡ Why This is Invite-Only
This script reflects deep backtesting and original integration of state logic specific to Bitcoin cycles, I also tried to choose the the correct conditions and invalidation points by using hma and smas in specific timeframes and lengths,
it has a system that also block many wrong buy signals during bearmarkets.
It encapsulates a rules-based trading process which goes beyond simply combining public indicators. The aim is to provide traders with a coherent framework that reduces false signals, adapts to bitcoin cycles, and promotes risk-aware participation in Bitcoin markets.
I also refined the line aesthetics and thicknesses to improve chart readability and help users quickly identify key levels.
⚡ Disclaimer
This is an analytical tool, not financial advice. Use with appropriate risk management and as part of a broader trading strategy.
Past positive results this indicator achieved do NOT guarantee future success !!
Per TradingView rules:
The logic is described sufficiently so that traders understand what it does and how it works.
This is not a simple mashup, but an original framework applying structured logic to Bitcoin macro trading.
This is a COMPLEMENTARY tool designed for use by my existing clients who are already familiar with my trading strategy and risk management approach. If you are not one of my clients or do not know my trading strategy, please do NOT request access or attempt to purchase it !!
⚡ Conformance
This description is written to comply with TradingView’s script publishing rules (tradingview.com/pine-script-docs/en/v5/writing/Publishing.html), as per recent moderator feedback.
If further clarification is required, I welcome additional feedback.

Langlands-Operadic Möbius Vortex (LOMV)Langlands-Operadic Möbius Vortex (LOMV)
Where Pure Mathematics Meets Market Reality
A Revolutionary Synthesis of Number Theory, Category Theory, and Market Dynamics
🎓 THEORETICAL FOUNDATION
The Langlands-Operadic Möbius Vortex represents a groundbreaking fusion of three profound mathematical frameworks that have never before been combined for market analysis:
The Langlands Program: Harmonic Analysis in Markets
Developed by Robert Langlands (Fields Medal recipient), the Langlands Program creates bridges between number theory, algebraic geometry, and harmonic analysis. In our indicator:
L-Function Implementation:
- Utilizes the Möbius function μ(n) for weighted price analysis
- Applies Riemann zeta function convergence principles
- Calculates quantum harmonic resonance between -2 and +2
- Measures deep mathematical patterns invisible to traditional analysis
The L-Function core calculation employs:
L_sum = Σ(return_val × μ(n) × n^(-s))
Where s is the critical strip parameter (0.5-2.5), controlling mathematical precision and signal smoothness.
Operadic Composition Theory: Multi-Strategy Democracy
Category theory and operads provide the mathematical framework for composing multiple trading strategies into a unified signal. This isn't simple averaging - it's mathematical composition using:
Strategy Composition Arity (2-5 strategies):
- Momentum analysis via RSI transformation
- Mean reversion through Bollinger Band mathematics
- Order Flow Polarity Index (revolutionary T3-smoothed volume analysis)
- Trend detection using Directional Movement
- Higher timeframe momentum confirmation
Agreement Threshold System: Democratic voting where strategies must reach consensus before signal generation. This prevents false signals during market uncertainty.
Möbius Function: Number Theory in Action
The Möbius function μ(n) forms the mathematical backbone:
- μ(n) = 1 if n is a square-free positive integer with even number of prime factors
- μ(n) = -1 if n is a square-free positive integer with odd number of prime factors
- μ(n) = 0 if n has a squared prime factor
This creates oscillating weights that reveal hidden market periodicities and harmonic structures.
🔧 COMPREHENSIVE INPUT SYSTEM
Langlands Program Parameters
Modular Level N (5-50, default 30):
Primary lookback for quantum harmonic analysis. Optimized by timeframe:
- Scalping (1-5min): 15-25
- Day Trading (15min-1H): 25-35
- Swing Trading (4H-1D): 35-50
- Asset-specific: Crypto 15-25, Stocks 30-40, Forex 35-45
L-Function Critical Strip (0.5-2.5, default 1.5):
Controls Riemann zeta convergence precision:
- Higher values: More stable, smoother signals
- Lower values: More reactive, catches quick moves
- High frequency: 0.8-1.2, Medium: 1.3-1.7, Low: 1.8-2.3
Frobenius Trace Period (5-50, default 21):
Galois representation lookback for price-volume correlation:
- Measures harmonic relationships in market flows
- Scalping: 8-15, Day Trading: 18-25, Swing: 25-40
HTF Multi-Scale Analysis:
Higher timeframe context prevents trading against major trends:
- Provides market bias and filters signals
- Improves win rates by 15-25% through trend alignment
Operadic Composition Parameters
Strategy Composition Arity (2-5, default 4):
Number of algorithms composed for final signal:
- Conservative: 4-5 strategies (higher confidence)
- Moderate: 3-4 strategies (balanced approach)
- Aggressive: 2-3 strategies (more frequent signals)
Category Agreement Threshold (2-5, default 3):
Democratic voting minimum for signal generation:
- Higher agreement: Fewer but higher quality signals
- Lower agreement: More signals, potential false positives
Swiss-Cheese Mixing (0.1-0.5, default 0.382):
Golden ratio φ⁻¹ based blending of trend factors:
- 0.382 is φ⁻¹, optimal for natural market fractals
- Higher values: Stronger trend following
- Lower values: More contrarian signals
OFPI Configuration:
- OFPI Length (5-30, default 14): Order Flow calculation period
- T3 Smoothing (3-10, default 5): Advanced exponential smoothing
- T3 Volume Factor (0.5-1.0, default 0.7): Smoothing aggressiveness control
Unified Scoring System
Component Weights (sum ≈ 1.0):
- L-Function Weight (0.1-0.5, default 0.3): Mathematical harmony emphasis
- Galois Rank Weight (0.1-0.5, default 0.2): Market structure complexity
- Operadic Weight (0.1-0.5, default 0.3): Multi-strategy consensus
- Correspondence Weight (0.1-0.5, default 0.2): Theory-practice alignment
Signal Threshold (0.5-10.0, default 5.0):
Quality filter producing:
- 8.0+: EXCEPTIONAL signals only
- 6.0-7.9: STRONG signals
- 4.0-5.9: MODERATE signals
- 2.0-3.9: WEAK signals
🎨 ADVANCED VISUAL SYSTEM
Multi-Dimensional Quantum Aura Bands
Five-layer resonance field showing market energy:
- Colors: Theme-matched gradients (Quantum purple, Holographic cyan, etc.)
- Expansion: Dynamic based on score intensity and volatility
- Function: Multi-timeframe support/resistance zones
Morphism Flow Portals
Category theory visualization showing market topology:
- Green/Cyan Portals: Bullish mathematical flow
- Red/Orange Portals: Bearish mathematical flow
- Size/Intensity: Proportional to signal strength
- Recursion Depth (1-8): Nested patterns for flow evolution
Fractal Grid System
Dynamic support/resistance with projected L-Scores:
- Multiple Timeframes: 10, 20, 30, 40, 50-period highs/lows
- Smart Spacing: Prevents level overlap using ATR-based minimum distance
- Projections: Estimated signal scores when price reaches levels
- Usage: Precise entry/exit timing with mathematical confirmation
Wick Pressure Analysis
Rejection level prediction using candle mathematics:
- Upper Wicks: Selling pressure zones (purple/red lines)
- Lower Wicks: Buying pressure zones (purple/green lines)
- Glow Intensity (1-8): Visual emphasis and line reach
- Application: Confluence with fractal grid creates high-probability zones
Regime Intensity Heatmap
Background coloring showing market energy:
- Black/Dark: Low activity, range-bound markets
- Purple Glow: Building momentum and trend development
- Bright Purple: High activity, strong directional moves
- Calculation: Combines trend, momentum, volatility, and score intensity
Six Professional Themes
- Quantum: Purple/violet for general trading and mathematical focus
- Holographic: Cyan/magenta optimized for cryptocurrency markets
- Crystalline: Blue/turquoise for conservative, stability-focused trading
- Plasma: Gold/magenta for high-energy volatility trading
- Cosmic Neon: Bright neon colors for maximum visibility and aggressive trading
📊 INSTITUTIONAL-GRADE DASHBOARD
Unified AI Score Section
- Total Score (-10 to +10): Primary decision metric
- >5: Strong bullish signals
- <-5: Strong bearish signals
- Quality ratings: EXCEPTIONAL > STRONG > MODERATE > WEAK
- Component Analysis: Individual L-Function, Galois, Operadic, and Correspondence contributions
Order Flow Analysis
Revolutionary OFPI integration:
- OFPI Value (-100% to +100%): Real buying vs selling pressure
- Visual Gauge: Horizontal bar chart showing flow intensity
- Momentum Status: SHIFTING, ACCELERATING, STRONG, MODERATE, or WEAK
- Trading Application: Flow shifts often precede major moves
Signal Performance Tracking
- Win Rate Monitoring: Real-time success percentage with emoji indicators
- Signal Count: Total signals generated for frequency analysis
- Current Position: LONG, SHORT, or NONE with P&L tracking
- Volatility Regime: HIGH, MEDIUM, or LOW classification
Market Structure Analysis
- Möbius Field Strength: Mathematical field oscillation intensity
- CHAOTIC: High complexity, use wider stops
- STRONG: Active field, normal position sizing
- MODERATE: Balanced conditions
- WEAK: Low activity, consider smaller positions
- HTF Trend: Higher timeframe bias (BULL/BEAR/NEUTRAL)
- Strategy Agreement: Multi-algorithm consensus level
Position Management
When in trades, displays:
- Entry Price: Original signal price
- Current P&L: Real-time percentage with risk level assessment
- Duration: Bars in trade for timing analysis
- Risk Level: HIGH/MEDIUM/LOW based on current exposure
🚀 SIGNAL GENERATION LOGIC
Balanced Long/Short Architecture
The indicator generates signals through multiple convergent pathways:
Long Entry Conditions:
- Score threshold breach with algorithmic agreement
- Strong bullish order flow (OFPI > 0.15) with positive composite signal
- Bullish pattern recognition with mathematical confirmation
- HTF trend alignment with momentum shifting
- Extreme bullish OFPI (>0.3) with any positive score
Short Entry Conditions:
- Score threshold breach with bearish agreement
- Strong bearish order flow (OFPI < -0.15) with negative composite signal
- Bearish pattern recognition with mathematical confirmation
- HTF trend alignment with momentum shifting
- Extreme bearish OFPI (<-0.3) with any negative score
Exit Logic:
- Score deterioration below continuation threshold
- Signal quality degradation
- Opposing order flow acceleration
- 10-bar minimum between signals prevents overtrading
⚙️ OPTIMIZATION GUIDELINES
Asset-Specific Settings
Cryptocurrency Trading:
- Modular Level: 15-25 (capture volatility)
- L-Function Precision: 0.8-1.3 (reactive to price swings)
- OFPI Length: 10-20 (fast correlation shifts)
- Cascade Levels: 5-7, Theme: Holographic
Stock Index Trading:
- Modular Level: 25-35 (balanced trending)
- L-Function Precision: 1.5-1.8 (stable patterns)
- OFPI Length: 14-20 (standard correlation)
- Cascade Levels: 4-5, Theme: Quantum
Forex Trading:
- Modular Level: 35-45 (smooth trends)
- L-Function Precision: 1.6-2.1 (high smoothing)
- OFPI Length: 18-25 (disable volume amplification)
- Cascade Levels: 3-4, Theme: Crystalline
Timeframe Optimization
Scalping (1-5 minute charts):
- Reduce all lookback parameters by 30-40%
- Increase L-Function precision for noise reduction
- Enable all visual elements for maximum information
- Use Small dashboard to save screen space
Day Trading (15 minute - 1 hour):
- Use default parameters as starting point
- Adjust based on market volatility
- Normal dashboard provides optimal information density
- Focus on OFPI momentum shifts for entries
Swing Trading (4 hour - Daily):
- Increase lookback parameters by 30-50%
- Higher L-Function precision for stability
- Large dashboard for comprehensive analysis
- Emphasize HTF trend alignment
🏆 ADVANCED TRADING STRATEGIES
The Mathematical Confluence Method
1. Wait for Fractal Grid level approach
2. Confirm with projected L-Score > threshold
3. Verify OFPI alignment with direction
4. Enter on portal signal with quality ≥ STRONG
5. Exit on score deterioration or opposing flow
The Regime Trading System
1. Monitor Aether Flow background intensity
2. Trade aggressively during bright purple periods
3. Reduce position size during dark periods
4. Use Möbius Field strength for stop placement
5. Align with HTF trend for maximum probability
The OFPI Momentum Strategy
1. Watch for momentum shifting detection
2. Confirm with accelerating flow in direction
3. Enter on immediate portal signal
4. Scale out at Fibonacci levels
5. Exit on flow deceleration or reversal
⚠️ RISK MANAGEMENT INTEGRATION
Mathematical Position Sizing
- Use Galois Rank for volatility-adjusted sizing
- Möbius Field strength determines stop width
- Fractal Dimension guides maximum exposure
- OFPI momentum affects entry timing
Signal Quality Filtering
- Trade only STRONG or EXCEPTIONAL quality signals
- Increase position size with higher agreement levels
- Reduce risk during CHAOTIC Möbius field periods
- Respect HTF trend alignment for directional bias
🔬 DEVELOPMENT JOURNEY
Creating the LOMV was an extraordinary mathematical undertaking that pushed the boundaries of what's possible in technical analysis. This indicator almost didn't happen. The theoretical complexity nearly proved insurmountable.
The Mathematical Challenge
Implementing the Langlands Program required deep research into:
- Number theory and the Möbius function
- Riemann zeta function convergence properties
- L-function analytical continuation
- Galois representations in finite fields
The mathematical literature spans decades of pure mathematics research, requiring translation from abstract theory to practical market application.
The Computational Complexity
Operadic composition theory demanded:
- Category theory implementation in Pine Script
- Multi-dimensional array management for strategy composition
- Real-time democratic voting algorithms
- Performance optimization for complex calculations
The Integration Breakthrough
Bringing together three disparate mathematical frameworks required:
- Novel approaches to signal weighting and combination
- Revolutionary Order Flow Polarity Index development
- Advanced T3 smoothing implementation
- Balanced signal generation preventing directional bias
Months of intensive research culminated in breakthrough moments when the mathematics finally aligned with market reality. The result is an indicator that reveals market structure invisible to conventional analysis while maintaining practical trading utility.
🎯 PRACTICAL IMPLEMENTATION
Getting Started
1. Apply indicator with default settings
2. Select appropriate theme for your markets
3. Observe dashboard metrics during different market conditions
4. Practice signal identification without trading
5. Gradually adjust parameters based on observations
Signal Confirmation Process
- Never trade on score alone - verify quality rating
- Confirm OFPI alignment with intended direction
- Check fractal grid level proximity for timing
- Ensure Möbius field strength supports position size
- Validate against HTF trend for bias confirmation
Performance Monitoring
- Track win rate in dashboard for strategy assessment
- Monitor component contributions for optimization
- Adjust threshold based on desired signal frequency
- Document performance across different market regimes
🌟 UNIQUE INNOVATIONS
1. First Integration of Langlands Program mathematics with practical trading
2. Revolutionary OFPI with T3 smoothing and momentum detection
3. Operadic Composition using category theory for signal democracy
4. Dynamic Fractal Grid with projected L-Score calculations
5. Multi-Dimensional Visualization through morphism flow portals
6. Regime-Adaptive Background showing market energy intensity
7. Balanced Signal Generation preventing directional bias
8. Professional Dashboard with institutional-grade metrics
📚 EDUCATIONAL VALUE
The LOMV serves as both a practical trading tool and an educational gateway to advanced mathematics. Traders gain exposure to:
- Pure mathematics applications in markets
- Category theory and operadic composition
- Number theory through Möbius function implementation
- Harmonic analysis via L-function calculations
- Advanced signal processing through T3 smoothing
⚖️ RESPONSIBLE USAGE
This indicator represents advanced mathematical research applied to market analysis. While the underlying mathematics are rigorously implemented, markets remain inherently unpredictable.
Key Principles:
- Use as part of comprehensive trading strategy
- Implement proper risk management at all times
- Backtest thoroughly before live implementation
- Understand that past performance does not guarantee future results
- Never risk more than you can afford to lose
The mathematics reveal deep market structure, but successful trading requires discipline, patience, and sound risk management beyond any indicator.
🔮 CONCLUSION
The Langlands-Operadic Möbius Vortex represents a quantum leap forward in technical analysis, bringing PhD-level pure mathematics to practical trading while maintaining visual elegance and usability.
From the harmonic analysis of the Langlands Program to the democratic composition of operadic theory, from the number-theoretic precision of the Möbius function to the revolutionary Order Flow Polarity Index, every component works in mathematical harmony to reveal the hidden order within market chaos.
This is more than an indicator - it's a mathematical lens that transforms how you see and understand market structure.
Trade with mathematical precision. Trade with the LOMV.
*"Mathematics is the language with which God has written the universe." - Galileo Galilei*
*In markets, as in nature, profound mathematical beauty underlies apparent chaos. The LOMV reveals this hidden order.*
— Dskyz, Trade with insight. Trade with anticipation.

Kijun Shifting Band Oscillator | QuantMAC🎯 Kijun Shifting Band Oscillator | QuantMAC
📊 **Revolutionary Technical Analysis Tool Combining Ancient Ichimoku Wisdom with Cutting-Edge Statistical Methods**
🌟 Overview
The Kijun Shifting Band Oscillator represents a sophisticated fusion of traditional Japanese technical analysis and modern statistical theory. Built upon the foundational concepts of the Ichimoku Kinko Hyo system, this indicator transforms the classic Kijun-sen (base line) into a dynamic, multi-dimensional analysis tool that provides traders with unprecedented market insights.
This advanced oscillator doesn't just show you where price has been – it reveals the underlying momentum dynamics and volatility patterns that drive market movements, giving you a statistical edge in your trading decisions.
🔥 Key Features & Innovations
Dual Trading Modes for Maximum Flexibility: 🚀
Long/Short Mode: Full bidirectional trading capability for aggressive traders seeking to capitalize on both bullish and bearish market conditions
Long/Cash Mode: Conservative approach perfect for risk-averse traders, taking long positions during uptrends and moving to cash during downtrends (avoiding short exposure)
Advanced Visual Intelligence: 🎨
9 Professional Color Schemes: From classic blue/navy to vibrant orange/purple combinations, each optimized for different chart backgrounds and personal preferences
Dynamic Gradient Histogram: Color intensity reflects oscillator strength, providing instant visual feedback on momentum magnitude
Intelligent Overlay Bands: Semi-transparent fills create clear visual boundaries without cluttering your chart
Smart Candle Coloring: Real-time color changes reflect current market state and trend direction
Customizable Threshold Lines: Clearly marked entry and exit levels with contrasting colors
Professional-Grade Analytics: 📊
Real-Time Performance Metrics: Live calculation of 9 key performance indicators
Risk-Adjusted Returns: Sharpe, Sortino, and Omega ratios for comprehensive performance evaluation
Position Sizing Guidance: Half-Kelly percentage for optimal risk management
Drawdown Analysis: Maximum drawdown tracking for risk assessment
📈 Deep Technical Foundation
Kijun-Based Mathematical Framework: 🧮
The indicator begins with the traditional Kijun-sen calculation but extends it significantly:
Statistical Enhancements: 📉
Adaptive Volatility: Bands expand and contract based on market volatility
Momentum Filtering: EMA smoothing of oscillator for trend confirmation
State Management: Intelligent signal filtering prevents whipsaws and false signals
Multi-Timeframe Compatibility: Optimized algorithms work across all timeframes
⚙️ Comprehensive Parameter Control
Kijun Core Settings: 🎛️
Kijun Length (Default: 30): Controls the lookback period for the base calculation. Shorter periods = more responsive, longer periods = smoother signals
Source Selection: Choose from Close, Open, High, Low, or HL2. Close price recommended for most applications
Calculation Method: Uses traditional Ichimoku methodology ensuring compatibility with classic analysis
Advanced Oscillator Configuration: 📊
Standard Deviation Length (Default: 36): Determines volatility measurement period. Affects band width and sensitivity
SD Multiplier (Default: 2.1): Fine-tune band distance from basis line. Higher values = wider bands, lower values = tighter bands
Oscillator Multiplier (Default: 100): Scales the final oscillator output. Useful for matching other indicators or personal preference
Smoothing Algorithm: Built-in EMA smoothing prevents noise while maintaining responsiveness
Signal Threshold Optimization: 🎯
Long Threshold (Default: 83): Oscillator level that triggers long entries. Higher values = fewer but stronger signals
Short Threshold (Default: 42): Oscillator level that triggers short entries. Lower values = fewer but stronger signals
Threshold Logic: Crossover-based system with state management prevents signal overlap
Customization Range: Fully adjustable to match your trading style and risk tolerance
Precision Date Control: 📅
Start Date/Month/Year: Precise backtesting control down to the day
Historical Analysis: Test strategies on specific market periods or events
Strategy Validation: Isolate performance during different market conditions
📊 Professional Metrics Dashboard
Risk Assessment Metrics: 💼
Maximum Drawdown %: Largest peak-to-trough decline in portfolio value. Critical for understanding worst-case scenarios and position sizing
Sortino Ratio: Risk-adjusted return measure focusing only on downside volatility. Superior to Sharpe ratio for asymmetric return distributions
Sharpe Ratio: Classic risk-adjusted performance metric. Values above 1.0 considered good, above 2.0 excellent
Omega Ratio: Probability-weighted ratio capturing all moments of return distribution. More comprehensive than Sharpe or Sortino
Performance Analytics: 📈
Profit Factor: Gross Profit ÷ Gross Loss. Values above 1.0 indicate profitability, above 2.0 considered excellent
Win Rate %: Percentage of profitable trades. Consider alongside average win/loss size for complete picture
Net Profit %: Total return on initial capital. Accounts for compounding effects
Total Trades: Sample size for statistical significance assessment
Advanced Position Sizing: 🎯
Half Kelly %: Optimal position size based on Kelly Criterion, reduced by 50% for safety margin
Risk Management: Helps determine appropriate position size relative to account equity
Mathematical Foundation: Based on win probability and profit factor calculations
Practical Application: Directly usable percentage for position sizing decisions
🎨 Advanced Display Options
Flexible Interface Design: 🖥️
6 Positioning Options: Top/Bottom/Middle × Left/Right combinations for optimal chart organization
Toggle Functionality: Show/hide metrics table for clean chart presentation during analysis
Color Coordination: Metrics table colors match selected oscillator color scheme
Professional Styling: Clean, readable format with proper spacing and alignment
Visual Hierarchy: 🎭
Oscillator Histogram: Primary focus with gradient intensity showing momentum strength
Threshold Lines: Clear horizontal references for entry/exit levels
Zero Line: Neutral reference point for trend bias determination
Background Bands: Subtle overlay context without chart clutter
🚀 Advanced Signal Generation System
Multi-Layer Signal Logic: ⚡
Primary Signal Generation: Oscillator crossover above Long Threshold (default 83) triggers long entries
Exit Signal Processing: Oscillator crossunder below Short Threshold (default 42) triggers position exits
State Management System: Prevents duplicate signals and ensures clean position transitions
Mode-Specific Logic: Different behavior for Long/Short vs Long/Cash modes
Date Range Filtering: Signals only generated within specified backtesting period
Confirmation Requirements: Bar confirmation prevents false signals from intrabar price spikes
Intelligent Position Management: 🧠
Entry Tracking: Precise entry price recording for accurate P&L calculations
Position State Monitoring: Continuous tracking of long/short/cash positions
Automatic Exit Logic: Seamless position closure and new position initiation
Performance Calculation: Real-time P&L tracking with compounding effects
📉📈 Comprehensive Band Interpretation Guide
Dynamic Band Analysis: 🔍
Upper Band Function: Represents dynamic resistance based on recent volatility. Price approaching upper band suggests potential reversal or breakout
Lower Band Function: Represents dynamic support with volatility adjustment. Price near lower band indicates oversold conditions or support testing
Middle Line (Basis): Trend direction indicator. Price above = bullish bias, price below = bearish bias
Band Width Interpretation: Wide bands = high volatility, narrow bands = low volatility/potential breakout setup
Band Slope Analysis: Rising bands = strengthening trend, falling bands = weakening trend
Oscillator Interpretation: 📊
Values Above 50: Price in upper half of recent range, bullish momentum
Values Below 50: Price in lower half of recent range, bearish momentum
Extreme Values (>80 or <20): Overbought/oversold conditions, potential reversal zones
Momentum Divergence: Oscillator direction vs price direction for early reversal signals
Trend Confirmation: Oscillator direction confirming or contradicting price trends
💡 Strategic Trading Applications
Primary Trading Strategies: 🎯
Trend Following: Use threshold crossovers to capture major directional moves. Best in trending markets with clear directional bias
Mean Reversion: Identify extreme oscillator readings for counter-trend opportunities. Effective in range-bound markets
Breakout Trading: Monitor band compressions followed by expansions for breakout signals
Swing Trading: Combine oscillator signals with band interactions for swing position entries/exits
Risk Management: Use metrics dashboard for position sizing and risk assessment
Market Condition Optimization: 🌊
Trending Markets: Increase threshold separation for fewer, stronger signals
Choppy Markets: Decrease threshold separation for more responsive signals
High Volatility: Increase SD multiplier for wider bands
Low Volatility: Decrease SD multiplier for tighter bands and earlier signals
⚙️ Advanced Configuration Tips
Parameter Optimization Guidelines: 🔧
Kijun Length Adjustment: Shorter periods (10-20) for faster signals, longer periods (50-100) for smoother trends
SD Length Tuning: Match to your trading timeframe - shorter for responsive, longer for stability
Threshold Calibration: Backtest different levels to find optimal entry/exit points for your market
Color Scheme Selection: Choose schemes that provide best contrast with your chart background and other indicators
Integration with Other Indicators: 🔗
Volume Indicators: Confirm oscillator signals with volume spikes
Support/Resistance: Use key levels to filter oscillator signals
Momentum Indicators: RSI, MACD confirmation for signal strength
Trend Indicators: Moving averages for overall trend bias confirmation
⚠️ Important Usage Notes & Limitations
Indicator Characteristics: ⚡
Lagging Nature: Based on historical price data - signals occur after moves have begun
Best Practice: Combine with leading indicators and price action analysis
Market Dependency: Performance varies across different market conditions and instruments
Backtesting Essential: Always validate parameters on historical data before live implementation
Optimization Recommendations: 🎯
Parameter Testing: Systematically test different combinations on your preferred instruments
Walk-Forward Analysis: Regularly re-optimize parameters to maintain effectiveness
Market Regime Awareness: Adjust parameters for different market conditions (trending vs ranging)
Risk Controls: Implement maximum drawdown limits and position size controls
🔧 Technical Specifications
Performance Optimization: ⚡
Efficient Algorithms: Optimized calculations for smooth real-time operation
Memory Management: Smart array handling for metrics calculations
Visual Optimization: Balanced detail vs performance for responsive charts
Multi-Symbol Ready: Consistent performance across different assets
---
The Kijun Shifting Band Oscillator represents the evolution of technical analysis, bridging the gap between traditional methods and modern quantitative approaches. This indicator provides traders with a comprehensive toolkit for market analysis, combining the intuitive wisdom of Japanese candlestick analysis with the precision of statistical mathematics.
🎯 Designed for serious traders who demand professional-grade analysis tools with institutional-quality metrics and risk management capabilities. Whether you're a discretionary trader seeking visual confirmation or a systematic trader building quantitative strategies, this indicator provides the foundation for informed trading decisions.
⚠️ IMPORTANT DISCLAIMER
Past Performance Warning: 📉⚠️
PAST PERFORMANCE IS NOT INDICATIVE OF FUTURE RESULTS. Historical backtesting results, while useful for strategy development and parameter optimization, do not guarantee similar performance in live trading conditions. Market conditions change continuously, and what worked in the past may not work in the future.
Remember: Successful trading requires discipline, continuous learning, and adaptation to changing market conditions. No indicator or strategy guarantees profits, and all trading involves substantial risk of loss.
